. 2018 Feb 7;9(2):182.
doi: 10.1038/s41419-017-0258-2.

miR-143-3p targeting of ITGA6 suppresses tumour growth and angiogenesis by downregulating PLGF expression via the PI3K/AKT pathway in gallbladder carcinoma

Affiliations

miR-143-3p targeting of ITGA6 suppresses tumour growth and angiogenesis by downregulating PLGF expression via the PI3K/AKT pathway in gallbladder carcinoma

Yun-Peng Jin et al. Cell Death Dis. .

Abstract

Gallbladder cancer (GBC) is the most common malignant tumour of the biliary track system. Angiogenesis plays a pivotal role in the development and progression of malignant tumours. miR-143-3p acts as a tumour suppressor in various cancers. Their role in GBC is however less well defined. Here we show that the expression levels of miR-143-3p were decreased in human GBC tissues compared with the non-tumour adjacent tissue (NAT) counterparts and were closely associated with overall survival. We discovered that miR-143-3p was a novel inhibitor of tumour growth and angiogenesis in vivo and in vitro. Our antibody array, ELISA and PLGF rescue analyses indicated that PLGF played an essential role in the antiangiogenic effect of miR-143-3p. Furthermore, we used miRNA target-prediction software and dual-luciferase assays to confirm that integrin α6 (ITGA6) acted as a direct target of miR-143-3p. Our ELISA and western blot analyses confirmed that the expression of PLGF was decreased via the ITGA6/PI3K/AKT pathway. In conclusion, miR-143-3p suppresses tumour angiogenesis and growth of GBC through the ITGA6/PI3K/AKT/PLGF pathways and may be a novel molecular therapeutic target for GBC.


Conflict of interest statement

The authors declare that they have no conflict of interest.

Figures

Fig. 1
Fig. 1. Downregulation of miR-143-3p is correlated with poor clinical outcomes in GBC patients.
a A portion of the cluster analysis of the miRNA expression profiles of the GBC tissues and NAT counterparts from our previous microarray results. b Scatterplots of the relative expression levels of miR-143-3p in the GBC tissues and their corresponding NATs. miR-143-3p expression was calculated and expressed as the miR-143-3p/U6 expression ratio (2−ΔCT). P = 0.0021. c Comparison of the miR-143-3p expression levels between the GBC tissues and their corresponding NATs. d Kaplan−Meier overall survival curve of GBC patients based on miR-143-3p expression. P < 0.001
Fig. 2
Fig. 2. miR-143-3p inhibits GBC cell proliferation and angiogenesis in vitro.
a, b Endothelial tube formation was estimated following incubation of HMVECs with conditioned medium from GBC cells transfected with mimics or inhibitors. The number of branches was quantified (**P < 0.01, ***P < 0.001; Student’s t test). Scale bar, 100 µm. c, d Invasion of HMVECs through the Matrigel chambers after incubation with conditioned medium from miR-143-3p-overexpressing or miR-143-3p-inhibited GBC cells for 48 h. Scale bar, 100 µm. The number of invading cells was calculated and is depicted in the bar graph (**P < 0.01, ***P < 0.001; Student’s t test). e Cell growth rates over 5 days were determined with CCK-8 proliferation assays (**P < 0.01, ***P < 0.001)
Fig. 3
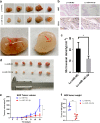
Fig. 3. miR-143-3p inhibits GBC cell angiogenesis and proliferation in vivo.
a Matrigel containing 20 U of heparin and NOZ cells transfected with Lv-miR-NC or Lv-miR-143-3p was subcutaneously implanted in 4−6-week-old male BALB/c athymic nude mice. After 7 days, the Matrigel plugs were removed and photographed. n = 5 per group. b H&E and CD31 staining of the Matrigel plug. Scale bar, 100 mm. c Quantification of the microvessel density (mm−2; n = 5; *P < 0.05; Student’s t test). d Representative examples of tumours formed in nude mice implanted with the indicated cells. e, f The tumour growth curves are summarized in the line chart. A statistical plot of the average tumour weights in the subcutaneous xenograft model (**P < 0.01, ***P < 0.001, n = 5)
Fig. 4
Fig. 4. miR-143-3p inhibits expression of PLGF.
a Human angiogenesis array analysis of the conditional medium from NOZ-mimic-NC and NOZ-miR-143-3p mimic cells. b A summary of the relative expression levels of the angiogenesis cytokines is provided in the bar graph. c PLGF in the supernatants of the NOZ and GBC-SD cells that were transfected with mimic NC or the miR-143-3p mimics were quantified by ELISA (n = 3; *P < 0.05, **P < 0.01; Student’s t test). d, e PLGF expression in the mimic (inhibitor) NC and miR-143-3p mimics (inhibitors)-transfected GBC cells was analysed by western blot and qRT-PCR analysis. GAPDH was used as the loading control. f, g Endothelial tube formation estimation after incubation of HMVECs with conditioned medium from mimic NC or miR-143-3p cancer cells with or without PLGF. The number of branches was quantified (P < 0.001; Student’s t test). h, i Invasion of HMVECs through the Matrigel chambers after incubation with conditioned medium from mimic NC or miR-143-3p cancer cells with or without PLGF. Scale bar, 100 µm. The number of invading cells was determined and is depicted in the bar graph (***P < 0.001; Student’s t test)
Fig. 5
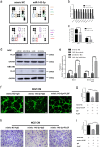
Fig. 5. ITGA6 is a direct target gene of miR-143-3p.
a Potential miR-143-3p targets predicted by the three miRNA target-prediction programmes (TargetScan, PicTar and miRDB). b The wild-type or mutant ITGA6 3′UTRs to determine the miR-143-3p binding site. c, d Overexpression of miR-143-3p attenuates ITGA6 protein and mRNA expression in NOZ and GBC-SD cells compared with the miRNA-NC group. Silencing of miR-143-3p promotes ITGA6 protein and mRNA expression in NOZ and GBC-SD cells compared with the miRNA-NC group. (*P < 0.05, **P < 0.01; Student’s t test). e The relative luciferase activity of the wild-type or mutant ITGA6 3′UTR in 293T cells after transfections with the miR-143-3p mimic or inhibitor and corresponding control (*P < 0.05, NS no significant). f Expression of ITGA6 in GBC cells infected with the miR-143-3p mimic or inhibitor and corresponding control was examined by immunofluorescence. The red signals represent ITGA6 staining. The nuclei were counterstained with DAPI
Fig. 6
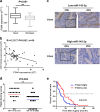
Fig. 6. ITGA6 expression at the mRNA level in human GBC tissues.
a The ITGA6 mRNA levels in 49 pairs of GBC tissues and their corresponding NATs. b The correlation between the expression levels of miR-143-3p and ITGA6 was determined using a linear regression analysis and a paired t test with the same samples used (P < 0.001, r = −0.2177, n = 49; Pearson’s correlation). c Representative IHC micrographs showing ITGA6 protein expression in GBC tissues with high or low miR-143-3p expression. Scale bar, 100 µm. d Scatterplots of the average staining scores of ITGA6 expression in the miR-143-3p-high or miR-143-3p-low tissues (**P < 0.01, n = 25 for miR-143-3p-low group; n = 24 for miR-143-3p high group). (e) Kaplan−Meier overall survival curve of GBC patients based on ITGA6 expression (P < 0.05, n = 49)
Fig. 7
Fig. 7. Overexpression of ITGA6 attenuates the inhibitory effects of miR-143-3p on GBC cells.
a, c Endothelial tube formation was estimated following incubation of HMVECs with conditioned medium from GBC cells transfected with mimic NC or miR-143-3p mimic and empty vector or ITGA6. The number of branches was quantified (*P < 0.05, **P < 0.01, ***P < 0.001; Student’s t test). Scale bar, 100 µm. b, d Invasion of HMVECs through the Matrigel chambers after incubation with conditioned medium from GBC cells co-transfected with mimic NC or miR-143-3p mimic and empty vector or ITGA6 for 48−72 h. Scale bar, 100 µm. The number of invading cells was determined and is depicted in the bar graph (**P < 0.01, ***P < 0.01; Student’s t test). e The growth rates of the GBC cells that were co-transfected with mimic NC or miR-143-3p mimics and empty vectors or ITGA6 were determined with CCK-8 proliferation assays (**P < 0.01, ***P < 0.001). f PLGF in the supernatants from NOZ and GBC-SD cells that were co-transfected with mimic NC or miR-143-3p mimic and empty vector or ITGA6 was quantified by ELISA (n = 3; *P < 0.05, ***P < 0.001; Student’s ttest). g Western blot for the ITGA6 and PLGF proteins in GBC cells that were co-transfected with mimic NC or miR-143-3p mimic and empty vector or ITGA6
Fig. 8
Fig. 8. miR-143-3p downregulates PLGF expression through the ITGA6/PI3K/AKT /STAT3 pathways.
a Western blot analysis of relevant proteins in the MAPK/ERK and PI3K/AKT pathways in GBC cells that were transfected with mimic (inhibitor) NC or miR-143-3p mimics (inhibitors). b Western blot analysis of relevant proteins in the MAPK/ERK and PI3K/AKT pathways in GBC cells that were co-transfected with mimic NC or miR-143-3p mimic and empty vector or ITGA6. c Working model of the miR-143-3p regulatory axis in GBC

Similar articles

Cited by

References

    1. Shu Y, et al. MicroRNA-29c-5p suppresses gallbladder carcinoma progression by directly targeting CPEB4 and inhibiting the MAPK pathway. Cell Death Differ. 2017;24:445–457. doi: 10.1038/cdd.2016.146. - DOI - PMC - PubMed
    1. Gourgiotis S, et al. Gallbladder cancer. Am. J. Surg. 2008;196:252–264. doi: 10.1016/j.amjsurg.2007.11.011. - DOI - PubMed
    1. Shu Y, et al. SPOCK1 as a potential cancer prognostic marker promotes the proliferation and metastasis of gallbladder cancer cells by activating the PI3K/AKT pathway. Mol. Cancer. 2015;14:12. doi: 10.1186/s12943-014-0276-y. - DOI - PMC - PubMed
    1. Zhang Y, et al. A novel PI3K/AKT signaling axis mediates Nectin-4-induced gallbladder cancer cell proliferation, metastasis and tumor growth. Cancer Lett. 2016;375:179–189. doi: 10.1016/j.canlet.2016.02.049. - DOI - PubMed
    1. Hundal R, Shaffer E. Gallbladder cancer: epidemiology and outcome. Clin. Epidemiol. 2014;6:99–109. - PMC - PubMed

Publication types

MeSH terms