. 2018 May 4;46(8):e50.
doi: 10.1093/nar/gky065.

Reconstructing spatial organizations of chromosomes through manifold learning

Affiliations

Reconstructing spatial organizations of chromosomes through manifold learning

Guangxiang Zhu et al. Nucleic Acids Res. .

Abstract

Decoding the spatial organizations of chromosomes has crucial implications for studying eukaryotic gene regulation. Recently, chromosomal conformation capture based technologies, such as Hi-C, have been widely used to uncover the interaction frequencies of genomic loci in a high-throughput and genome-wide manner and provide new insights into the folding of three-dimensional (3D) genome structure. In this paper, we develop a novel manifold learning based framework, called GEM (Genomic organization reconstructor based on conformational Energy and Manifold learning), to reconstruct the three-dimensional organizations of chromosomes by integrating Hi-C data with biophysical feasibility. Unlike previous methods, which explicitly assume specific relationships between Hi-C interaction frequencies and spatial distances, our model directly embeds the neighboring affinities from Hi-C space into 3D Euclidean space. Extensive validations demonstrated that GEM not only greatly outperformed other state-of-art modeling methods but also provided a physically and physiologically valid 3D representations of the organizations of chromosomes. Furthermore, we for the first time apply the modeled chromatin structures to recover long-range genomic interactions missing from original Hi-C data.


Figures
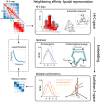
Figure 1.
Figure 1.
A schematic illustration of the GEM pipeline. The genomic loci A, B, C and D are selected as an example to demonstrate our pipeline. We first build up an interaction network from the input Hi-C data to represent the organizations of chromatin structures in Hi-C space. In this interaction network, each node represents a genomic loci and each edge represents a pairwise interaction describing the neighbouring affinity between genomic loci in Hi-C space. Based on an optimization that considers both the KL divergence between experimental and reconstructed Hi-C data and the conformational energy, the interaction network is then embedded into 3D Euclidean space to reconstruct the 3D chromatin structures. During the embedding process, we first calculate an average conformation as an initial structure, and then refine the initial structure to obtain an ensemble of conformations through a multi-conformation optimization technique (see Materials and Methods). Finally, we can infer the latent function between Hi-C interaction frequencies and spatial distances between genomic loci based on the input interaction frequency matrix and the output spatial distance matrix derived from GEM (shown in the dashed box). Neighboring probability, NP(B), in the figure represents the probability of the spatial interaction between current genomic and genomic locus B.
Figure 2.
Figure 2.
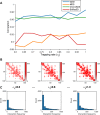
The validation results on the simulated Hi-C data, which were generated according to different settings of the trapping rate αt (see Supplementary Methods). (A) The comparisons of Pearson correlations between GEM and other modeling methods, including the MDS (29,30) based model, ChromSDE (17) and ShRec3D (18). (B and C) show the typical examples of the simulated Hi-C maps and the corresponding distributions of the simulated interaction frequencies as αt increases, respectively. In the simulated Hi-C maps, the axes denote the genomic loci (1 Mb resolution) and the values of the entries indicate the simulated interaction frequencies. In the histograms, the x axes denote the interaction frequencies obtained from the Hi-C maps and the y axes denote the numbers of data points falling into individual interaction frequency intervals.
Figure 3.
Figure 3.
The chromatin structure modeling results on human chromosomes under 1 Mb resolution. (A) Visualization of the computed ensemble of human chromosome 14. The four conformations {s(1), s(2), s(3), s(4)} in the derived ensemble are shown in red, blue, green and orange, respectively. The middle shows the superimposition of all four conformations, which were all aligned using the singular value decomposition (SVD) algorithm (54). The three large isolated regions (α, β, γ) which can be facilely distinguished from the reconstructed 3D conformations were consistent well with those detected based on the original Hi-C map (see (C)). (B) The 10-fold cross-validation results for human chromosome 14, in which the scatter plot of the reconstructed Hi-C data derived from the modeled structures vs. the original Hi-C data is shown. (C, D) The original interaction frequency map derived from experimental Hi-C data and the reconstructed Hi-C map predicted by the modeled structures for human chromosome 14 in the 10-fold cross-validation results, respectively. In the Hi-C maps, the axes denote the genomic loci (1 Mb resolution) and the values of the entries indicate the experimentally measured (C) and predicted (D) interaction frequencies, respectively. (E) Bar graph depicting mutual validation by two sets of experimental Hi-C data for individual 23 human chromosomes, which were collected using two different restriction enzymes (i.e., HindIII vs. NcoI), respectively. (FG) Comparison results between different modeling methods, in terms of the agreement between experimental and predicted Hi-C data and the conformational energy, respectively.
Figure 4.
Figure 4.
The validation results on the known pairwise distance constraints derived from the FISH imaging data of yeast and human. (A) The validation results on the FISH imaging data of yeast chromosome 6. ARS603, ARS606, ARS607 and ARS609 lie consecutively along the chromosome. The genomic distance intervals of ARS603, ARS606, ARS607 and ARS609 are 103, 32 and 56 kb, respectively. ARS603 belongs to compartment A, while the other three loci belong to compartment B. (B) The validation results on the FISH imaging data of human chromosome 14. L1, L2, L3 and L4 lie consecutively along the chromosome. The genomic distance intervals of L1, L2, L3 and L4 are 23, 22 and 19 kb, respectively. L1 and L3 belong to compartment A, while L2 and L4 belong to compartment B. In (A) and (B), top shows the schematic illustrations of the locations of genomic loci used in the validation. Compartment partition was performed based on the eigenvectors of the Hi-C maps computed by principal component analysis (PCA) (7). Bottom shows the bar graphs depicting the comparisons between the mean distances between genomic loci derived from FISH imaging data and reconstructed by GEM. (CE) The validation results on the FISH data (48) that include FISH distances between 34 TADs on human chromosome 21. (C) Visualization of the relative errors between the reconstructed distances by GEM and FISH distances, in which the axes denote the index of TADs and the values of the entries indicate the relative errors. (D) Comparison between different models in terms of relative errors between reconstructed spatial distances and FISH distances averaged over all pairs of TADs. (E) Red scatter plot shows the inverse Hi-C interaction frequencies between individual pairs of TADs versus their corresponding spatial distances derived from the FISH imaging data, while blue scatter plot shows the inverse Hi-C interaction frequencies between individual pairs of TADs versus their corresponding mean spatial distances computed by GEM.
Figure 5.
Figure 5.
Relationships between Hi-C interaction frequencies and reconstructed spatial distances derived based on different test settings of simulated Hi-C data. The purple curves depict the latent relationships between Hi-C interaction frequencies and reconstructed spatial distances derived based on the tests on simulated Hi-C data, which were generated according to different settings of the trapping rate αt (A), the maximum interaction probability Pm (B), the standard deviation of Gaussian function σ (C), and the number of cells Nc (D), respectively. The blue, orange and green curves show the functions inferred by GEM, the hypothetical function F∝1/D used in the MDS (29,30) based model and ShRec3D (18), and the hypothetical function F∝1/Dα used in ChromSDE (17), respectively. The root-mean-square error (RMSE) was used to measure the distances between these functions used in the modeling frameworks (shown in blue, orange or green curves) and the latent functions (shown in purple curves), which can be derived from the parameter settings used to generate the simulated Hi-C data.
Figure 6.
Figure 6.
Relationships between Hi-C interaction frequencies and reconstructed spatial distances derived from the chromatin structures modeled by GEM on experimental Hi-C data. (A–D) The latent functions inferred by GEM between Hi-C interaction frequencies and reconstructed spatial distances on human chromosome 13 at 1Mb resolution, human chromosome 14 at 1Mb resolution, a 130Mb-180Mb region of human chromosome 1 at 250 kb resolution, and yeast chromosome 6 at 10 kb resolution, respectively. The functions were obtained by curve fitting to the points representing the pairs of Hi-C interaction frequencies and reconstructed spatial distances in the modeled structures. The expressions of the derived functions and the fitting results measured in terms of the root-mean-square errors (RMSEs) are also shown.
Figure 7.
Figure 7.
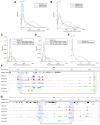
Application of the chromatin structures reconstructed by GEM into the recovery of missing long-range loops or contacts. (AB) The recovery results on the missing loops on human chromosome 19 in the GM12878 cell line at 5 kb resolution from the Hi-C data of replicate 1 and replicate 2 (50), respectively. The orange curves represent the distributions of known loops (which were present in the Hi-C data of current replicate), while the blue curves represent the distributions of missing loops (which were missing in current replicate but present in the other replicate). The purple curves show the background distributions, i.e., the distributions of spatial distances in the reconstructed structures. The HiCCUPS algorithm (50) implemented in the Juicer tools (55), with 0.1% FDR, was used to call chromatin loops from Hi-C maps. (CE) The recovery results on the missing promoter–promoter and promoter–enhancer contacts on human chromosome 19, using the chromatin structures reconstructed by GEM based on the promoter-other contacts derived from the capture Hi-C data (51). The purple curves show the background distributions, i.e. the distributions of all the reconstructed spatial distances (as in (A, B)), while the other curves represent the distributions of the promoter–promoter or promoter–enhancer contacts that were missing in the input promoter-other capture Hi-C data (51) but present in an independent Hi-C map (C), the promoter–promoter contacts derived from another capture Hi-C data (D), or the promoter–enhancer contacts identified by PSYCHIC (52) from an independent Hi-C map (50), all of which were also called the validation Hi-C data. In (C) and (D), the blue, orange and green curves represent the distributions of the top 5, 25 and 50 missing promoter–promoter contacts which had the highest interaction frequencies in the validation Hi-C data. In Panels (F), the blue curve represents the distribution of the missing promoter–enhancer contacts in the validation Hi-C data. (F, G) Two examples on the recovered promoter–enhancer (F) or promoter–promoter (G) contacts on human chromosome 19 of the GM12878 cell line that were recovered from the chromatin structures reconstructed by GEM from one Hi-C dataset and can be validated by another independent Hi-C dataset. The recovered loops are shown by orange linkers on the bottom, while the connected promoter and enhancers regions (which were annotated using the combination of ENCODE Segway (56) and ChromHMM (57) as in (58)) are shown in blue and green, respectively. Among the lists of chromatin features, H3K27 and DNase-seq signals indicate the active and accessibility states of both ends of chromatin loops, while the states of promoters and enhancers are marked by H3K4me3 and H3K4me1, respectively. All ChIP-seq and DNase-seq data were obtained from the ENCODE portal (59). The human reference genome GRCh38/hg38 was used.

Similar articles

Cited by

References

    1. de Laat W., Grosveld F.. Spatial organization of gene expression: the active chromatin hub. Chromosome Res. 2003; 11:447–459. - PubMed
    1. Fraser P., Bickmore W.. Nuclear organization of the genome and the potential for gene regulation. Nature. 2007; 447:413–417. - PubMed
    1. Cremer T., Cremer C.. Chromosome territories, nuclear architecture and gene regulation in mammalian cells. Nat. Rev. Genet. 2001; 2:292–301. - PubMed
    1. Misteli T. Beyond the sequence: cellular organization of genome function. Cell. 2007; 128:787–800. - PubMed
    1. Dekker J., Rippe K., Dekker M., Kleckner N.. Capturing chromosome conformation. Science. 2002; 295:1306–1311. - PubMed

Publication types

MeSH terms