

Antitumor effects of metformin are a result of inhibiting nuclear factor kappa B nuclear translocation in esophageal squamous cell carcinoma
- PMID: 29396886
- PMCID: PMC5891201
- DOI: 10.1111/cas.13523
Antitumor effects of metformin are a result of inhibiting nuclear factor kappa B nuclear translocation in esophageal squamous cell carcinoma
Abstract
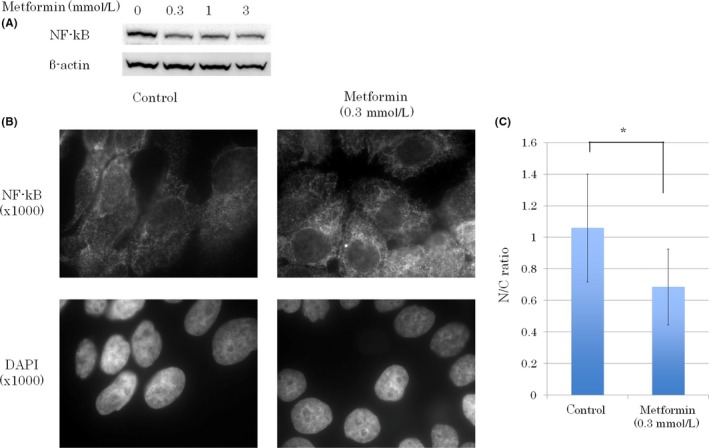
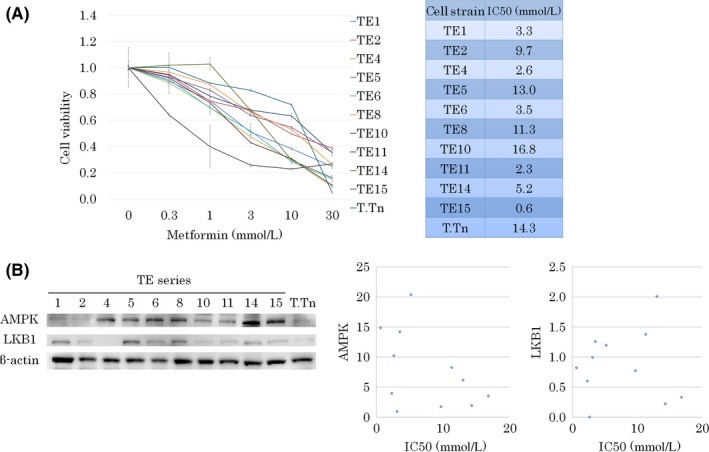
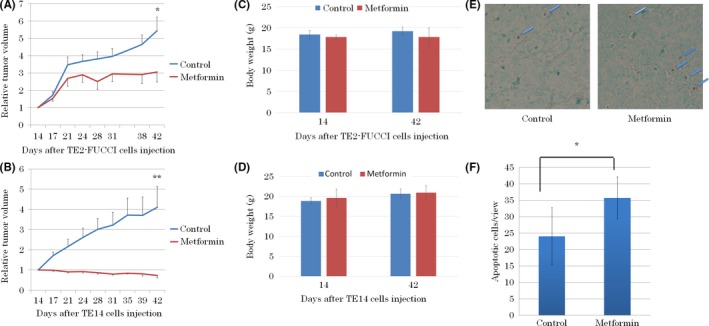
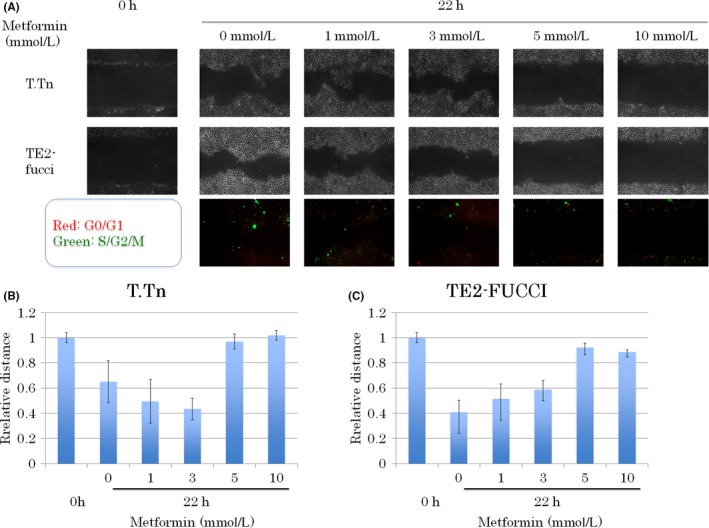
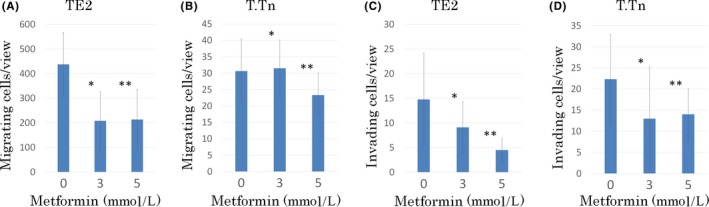
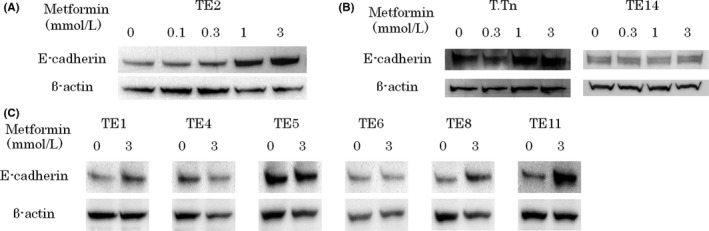
Esophageal squamous cell carcinoma (ESCC) is an intractable digestive organ cancer that has proven difficult to treat despite multidisciplinary therapy, and a new treatment strategy is demanded. Metformin is used for type 2 diabetes mellitus and its antitumor effects have been reported recently. Metformin exerts antitumor effects in various respects, such as inhibiting inflammation, tumor growth and epithelial-mesenchymal transition (EMT). However, few reports have described the efficacy of metformin on ESCC, and their findings have been controversial. We analyzed the antitumor effects of metformin and clarified its effects on anti-inflammation, growth suppression and EMT inhibition. Activation of nuclear factor kappa B (NF-κB), the major transcription factor induced by inflammation, was investigated by immunostaining. We found that localization of NF-κB in the nucleus was reduced after metformin treatment. This suggests that metformin inhibited the activation of NF-κB. Metformin inhibited tumor growth and induced apoptosis in ESCC cell lines. Associated with EMT, we examined cell motility by a wound healing assay and the epithelial marker E-cadherin expression of various ESCC cell lines by western blotting. Metformin inhibited cell motility and induced E-cadherin expression. In conclusion, metformin showed multiple antitumor effects such as growth suppression, invasion inhibition, and control of EMT by inhibiting NF-κB localization on ESCC. Further exploration of the marker of treatment efficacy and combination therapy could result in the possibility for novel treatment to use metformin on ESCC.
Keywords: epithelial-mesenchymal transition; esophageal squamous cell carcinoma; inflammation; metformin; treatment outcome.
© 2018 The Authors. Cancer Science published by John Wiley & Sons Australia, Ltd on behalf of Japanese Cancer Association.
Figures
Similar articles
-
Metformin in Esophageal Carcinoma: Exploring Molecular Mechanisms and Therapeutic Insights.Int J Mol Sci. 2024 Mar 4;25(5):2978. doi: 10.3390/ijms25052978. Int J Mol Sci. 2024. PMID: 38474224 Free PMC article. Review.
-
Pristimerin targeting NF-κB pathway inhibits proliferation, migration, and invasion in esophageal squamous cell carcinoma cells.Cell Biochem Funct. 2018 Jun;36(4):228-240. doi: 10.1002/cbf.3335. Epub 2018 May 20. Cell Biochem Funct. 2018. PMID: 29781107
-
Curcumin potentiates the antitumor effects of 5-FU in treatment of esophageal squamous carcinoma cells through downregulating the activation of NF-κB signaling pathway in vitro and in vivo.Acta Biochim Biophys Sin (Shanghai). 2012 Oct;44(10):847-55. doi: 10.1093/abbs/gms074. Acta Biochim Biophys Sin (Shanghai). 2012. PMID: 23017833
-
miR-145-5p Suppresses Tumor Cell Migration, Invasion and Epithelial to Mesenchymal Transition by Regulating the Sp1/NF-κB Signaling Pathway in Esophageal Squamous Cell Carcinoma.Int J Mol Sci. 2017 Aug 23;18(9):1833. doi: 10.3390/ijms18091833. Int J Mol Sci. 2017. PMID: 28832500 Free PMC article.
-
Current findings on the antitumor effects of metformin on esophageal squamous cell carcinoma (Review).Mol Clin Oncol. 2024 Jun 28;21(2):58. doi: 10.3892/mco.2024.2756. eCollection 2024 Aug. Mol Clin Oncol. 2024. PMID: 39006474 Free PMC article. Review.
Cited by
-
Interaction Between Prediabetes and the ABO Blood Types in Predicting Postsurgical Esophageal Squamous Cell Carcinoma-Specific Mortality: The FIESTA Study.Front Oncol. 2018 Oct 23;8:461. doi: 10.3389/fonc.2018.00461. eCollection 2018. Front Oncol. 2018. PMID: 30406028 Free PMC article.
-
WTAP promotes proliferation of esophageal squamous cell carcinoma via m6A-dependent epigenetic promoting of PTP4A1.Cancer Sci. 2024 Jul;115(7):2254-2268. doi: 10.1111/cas.15924. Epub 2024 May 15. Cancer Sci. 2024. PMID: 38746998 Free PMC article.
-
Action Mechanism of Metformin and Its Application in Hematological Malignancy Treatments: A Review.Biomolecules. 2023 Jan 29;13(2):250. doi: 10.3390/biom13020250. Biomolecules. 2023. PMID: 36830619 Free PMC article. Review.
-
Mesalazine induces apoptosis via mitochondrial pathway in K562 cell line.Vet Res Forum. 2022 Mar;13(1):121-126. doi: 10.30466/vrf.2020.117585.2788. Epub 2022 Mar 15. Vet Res Forum. 2022. PMID: 35601773 Free PMC article.
-
Metformin in Esophageal Carcinoma: Exploring Molecular Mechanisms and Therapeutic Insights.Int J Mol Sci. 2024 Mar 4;25(5):2978. doi: 10.3390/ijms25052978. Int J Mol Sci. 2024. PMID: 38474224 Free PMC article. Review.
References
-
- Pennathur A, Gibson MK, Jobe BA, Luketich JD. Oesophageal carcinoma. Lancet. 2013;381:400‐412. - PubMed
-
- Isozaki Y, Hoshino I, Nohata N, et al. Identification of novel molecular targets regulated by tumor suppressive miR‐375 induced by histone acetylation in esophageal squamous cell carcinoma. Int J Oncol. 2012;41:985‐994. - PubMed
-
- Isozaki Y, Hoshino I, Akutsu Y, et al. Screening of alternative drugs to the tumor suppressor miR‐375 in esophageal squamous cell carcinoma using the connectivity map. Oncology. 2014;87:351‐363. - PubMed
-
- Micic D, Cvijovic G, Trajkovic V, Duntas LH, Polovina S. Metformin: its emerging role in oncology. Hormones (Athens). 2011;10:5‐15. - PubMed
MeSH terms
Substances
LinkOut - more resources
Full Text Sources
Other Literature Sources
