Estimation of clinical trial success rates and related parameters
- PMID: 29394327
- PMCID: PMC6409418
- DOI: 10.1093/biostatistics/kxx069
Estimation of clinical trial success rates and related parameters
Erratum in
-
Corrigendum: Estimation of clinical trial success rates and related parameters.Biostatistics. 2019 Apr 1;20(2):366. doi: 10.1093/biostatistics/kxy072. Biostatistics. 2019. PMID: 30445524 Free PMC article. No abstract available.
Abstract
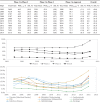
Previous estimates of drug development success rates rely on relatively small samples from databases curated by the pharmaceutical industry and are subject to potential selection biases. Using a sample of 406 038 entries of clinical trial data for over 21 143 compounds from January 1, 2000 to October 31, 2015, we estimate aggregate clinical trial success rates and durations. We also compute disaggregated estimates across several trial features including disease type, clinical phase, industry or academic sponsor, biomarker presence, lead indication status, and time. In several cases, our results differ significantly in detail from widely cited statistics. For example, oncology has a 3.4% success rate in our sample vs. 5.1% in prior studies. However, after declining to 1.7% in 2012, this rate has improved to 2.5% and 8.3% in 2014 and 2015, respectively. In addition, trials that use biomarkers in patient-selection have higher overall success probabilities than trials without biomarkers.
Keywords: Clinical phase transition probabilities; Clinical trial statistics; Probabilities of success.
© The Author 2018. Published by Oxford University Press.
Figures

Similar articles
-
Trends in risks associated with new drug development: success rates for investigational drugs.Clin Pharmacol Ther. 2010 Mar;87(3):272-7. doi: 10.1038/clpt.2009.295. Epub 2010 Feb 3. Clin Pharmacol Ther. 2010. PMID: 20130567 Review.
-
The project data sphere initiative: accelerating cancer research by sharing data.Oncologist. 2015 May;20(5):464-e20. doi: 10.1634/theoncologist.2014-0431. Epub 2015 Apr 15. Oncologist. 2015. PMID: 25876994 Free PMC article.
-
Biomarkers and receptor targeted therapies reduce clinical trial risk in non-small-cell lung cancer.J Thorac Oncol. 2014 Feb;9(2):163-9. doi: 10.1097/JTO.0000000000000075. J Thorac Oncol. 2014. PMID: 24419412
-
Analysis of Factors Affecting Successful Clinical Trial Enrollment in the Context of Three Prospective, Randomized, Controlled Trials.Int J Radiat Oncol Biol Phys. 2017 Mar 15;97(4):770-777. doi: 10.1016/j.ijrobp.2016.11.035. Epub 2016 Nov 27. Int J Radiat Oncol Biol Phys. 2017. PMID: 28244413 Free PMC article. Clinical Trial.
-
Innovation in oncology clinical trial design.Cancer Treat Rev. 2019 Mar;74:15-20. doi: 10.1016/j.ctrv.2019.01.001. Epub 2019 Jan 4. Cancer Treat Rev. 2019. PMID: 30665053 Review.
Cited by
-
Modeling of Nanotherapy Response as a Function of the Tumor Microenvironment: Focus on Liver Metastasis.Front Bioeng Biotechnol. 2020 Aug 19;8:1011. doi: 10.3389/fbioe.2020.01011. eCollection 2020. Front Bioeng Biotechnol. 2020. PMID: 32974325 Free PMC article. Review.
-
Disease stages and therapeutic hypotheses in two decades of neurodegenerative disease clinical trials.Sci Rep. 2022 Oct 21;12(1):17708. doi: 10.1038/s41598-022-21820-1. Sci Rep. 2022. PMID: 36271285 Free PMC article.
-
Facilitating Drug Discovery in Breast Cancer by Virtually Screening Patients Using In Vitro Drug Response Modeling.Cancers (Basel). 2021 Feb 20;13(4):885. doi: 10.3390/cancers13040885. Cancers (Basel). 2021. PMID: 33672646 Free PMC article.
-
Peptide-protein coassembling matrices as a biomimetic 3D model of ovarian cancer.Sci Adv. 2020 Oct 2;6(40):eabb3298. doi: 10.1126/sciadv.abb3298. Print 2020 Oct. Sci Adv. 2020. PMID: 33008910 Free PMC article.
-
What's not in the news headlines or titles of Alzheimer disease articles? #InMice.PLoS Biol. 2021 Jun 15;19(6):e3001260. doi: 10.1371/journal.pbio.3001260. eCollection 2021 Jun. PLoS Biol. 2021. PMID: 34129637 Free PMC article.
References
-
- Abrantes-Metz R. M., Adams C. and Metz A. D. (2005). Pharmaceutical development phases: a duration analysis. Journal of Pharmaceutical Finance, Economics and Policy 14, 19–42.
-
- Danzon P. M., Nicholson S. and Pereira N. S. (2005). Productivity in pharmaceutical–biotechnology R&D: the role of experience and alliances. Journal of Health Economics 24, 317–339. - PubMed
-
- DiMasi J. A., Feldman L., Seckler A. and Wilson A. (2010). Trends in risks associated with new drug development: success rates for investigational drugs. Clinical Pharmacology and Therapeutics 87, 272–277. - PubMed
-
- Hay M., Thomas D. W., Craighead J. L., Economides C. and Rosenthal J. (2014). Clinical development success rates for investigational drugs. Nature Biotechnology 32, 40–51. - PubMed
-
- Malec P. and Schienle M. (2014). Nonparametric kernel density estimation near the boundary. Computational Statistics & Data Analysis 72, 57–76.
Publication types
MeSH terms
Substances
LinkOut - more resources
Full Text Sources
Other Literature Sources
Medical

