

Experimental maps of DNA structure at nucleotide resolution distinguish intrinsic from protein-induced DNA deformations
- PMID: 29390080
- PMCID: PMC5946862
- DOI: 10.1093/nar/gky033
Experimental maps of DNA structure at nucleotide resolution distinguish intrinsic from protein-induced DNA deformations
Abstract
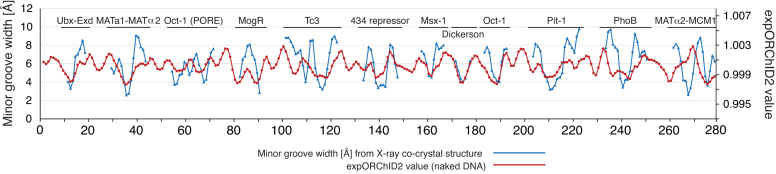
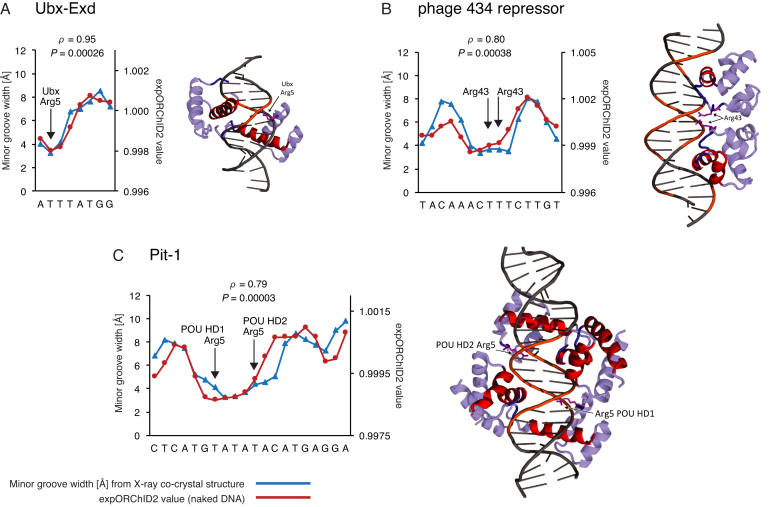
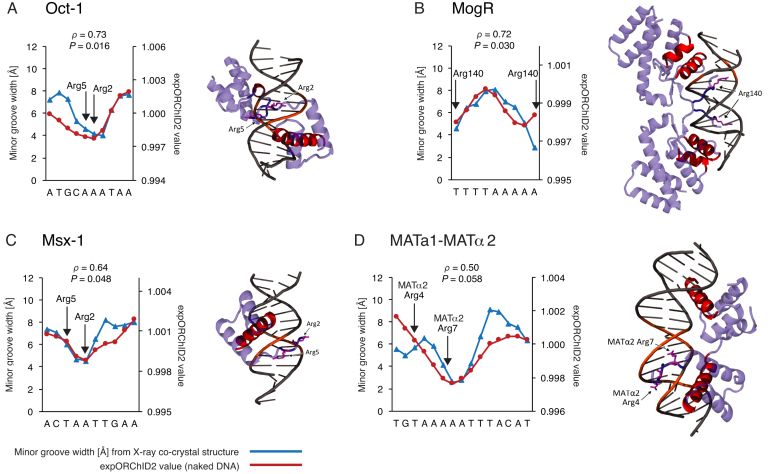
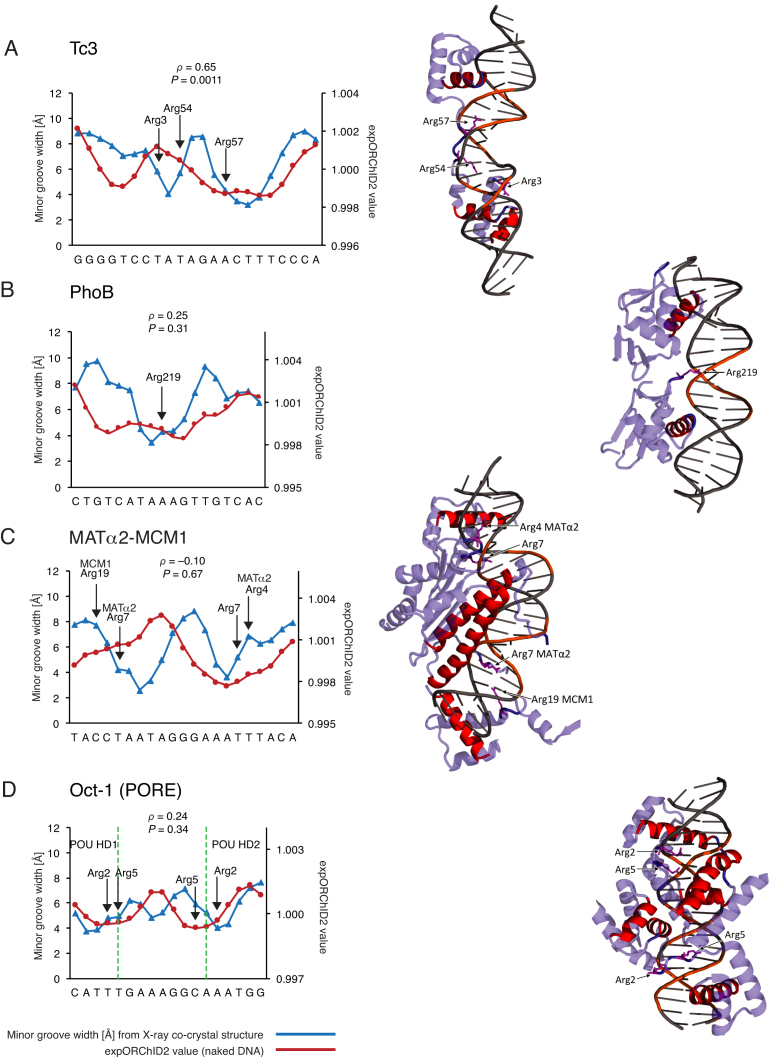
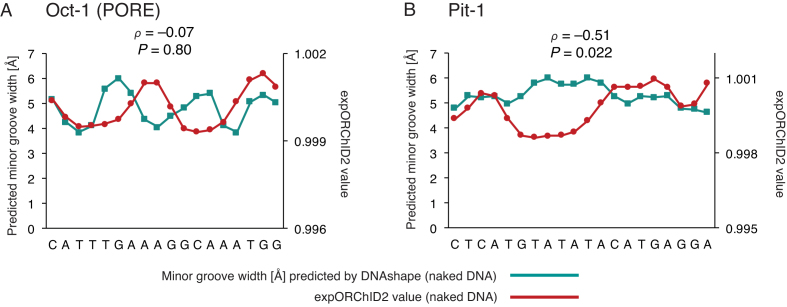
Recognition of DNA by proteins depends on DNA sequence and structure. Often unanswered is whether the structure of naked DNA persists in a protein-DNA complex, or whether protein binding changes DNA shape. While X-ray structures of protein-DNA complexes are numerous, the structure of naked cognate DNA is seldom available experimentally. We present here an experimental and computational analysis pipeline that uses hydroxyl radical cleavage to map, at single-nucleotide resolution, DNA minor groove width, a recognition feature widely exploited by proteins. For 11 protein-DNA complexes, we compared experimental maps of naked DNA minor groove width with minor groove width measured from X-ray co-crystal structures. Seven sites had similar minor groove widths as naked DNA and when bound to protein. For four sites, part of the DNA in the complex had the same structure as naked DNA, and part changed structure upon protein binding. We compared the experimental map with minor groove patterns of DNA predicted by two computational approaches, DNAshape and ORChID2, and found good but not perfect concordance with both. This experimental approach will be useful in mapping structures of DNA sequences for which high-resolution structural data are unavailable. This approach allows probing of protein family-dependent readout mechanisms.
Figures
Similar articles
-
Protein-DNA hydrophobic recognition in the minor groove is facilitated by sugar switching.J Mol Biol. 2004 Mar 12;337(1):65-76. doi: 10.1016/j.jmb.2004.01.011. J Mol Biol. 2004. PMID: 15001352
-
A map of minor groove shape and electrostatic potential from hydroxyl radical cleavage patterns of DNA.ACS Chem Biol. 2011 Dec 16;6(12):1314-20. doi: 10.1021/cb200155t. Epub 2011 Oct 13. ACS Chem Biol. 2011. PMID: 21967305 Free PMC article.
-
Sequence-specific transitions of the torsion angle gamma change the polar-hydrophobic profile of the DNA grooves: implication for indirect protein-DNA recognition.J Biomol Struct Dyn. 2014;32(10):1670-85. doi: 10.1080/07391102.2013.830579. Epub 2013 Sep 2. J Biomol Struct Dyn. 2014. PMID: 23998351
-
Origins of specificity in protein-DNA recognition.Annu Rev Biochem. 2010;79:233-69. doi: 10.1146/annurev-biochem-060408-091030. Annu Rev Biochem. 2010. PMID: 20334529 Free PMC article. Review.
-
Minor groove-binding architectural proteins: structure, function, and DNA recognition.Annu Rev Biophys Biomol Struct. 1998;27:105-31. doi: 10.1146/annurev.biophys.27.1.105. Annu Rev Biophys Biomol Struct. 1998. PMID: 9646864 Free PMC article. Review.
Cited by
-
New insights into protein-DNA binding specificity from hydrogen bond based comparative study.Nucleic Acids Res. 2019 Dec 2;47(21):11103-11113. doi: 10.1093/nar/gkz963. Nucleic Acids Res. 2019. PMID: 31665426 Free PMC article.
-
Intrinsic DNA Shape Accounts for Affinity Differences between Hox-Cofactor Binding Sites.Cell Rep. 2018 Aug 28;24(9):2221-2230. doi: 10.1016/j.celrep.2018.07.100. Cell Rep. 2018. PMID: 30157419 Free PMC article.
-
Flexibility of flanking DNA is a key determinant of transcription factor affinity for the core motif.Biophys J. 2022 Oct 18;121(20):3987-4000. doi: 10.1016/j.bpj.2022.08.015. Epub 2022 Aug 17. Biophys J. 2022. PMID: 35978548 Free PMC article.
-
DNA mismatches reveal conformational penalties in protein-DNA recognition.Nature. 2020 Nov;587(7833):291-296. doi: 10.1038/s41586-020-2843-2. Epub 2020 Oct 21. Nature. 2020. PMID: 33087930 Free PMC article.
-
A New Generation of Minor-Groove-Binding-Heterocyclic Diamidines That Recognize G·C Base Pairs in an AT Sequence Context.Molecules. 2019 Mar 7;24(5):946. doi: 10.3390/molecules24050946. Molecules. 2019. PMID: 30866557 Free PMC article. Review.
References
-
- Garvie C.W., Wolberger C.. Recognition of specific DNA sequences. Mol. Cell. 2001; 8:937–946. - PubMed
Publication types
MeSH terms
Substances
Grants and funding
LinkOut - more resources
Full Text Sources
Other Literature Sources
