. 2018 Jan 30;19(2):406.
doi: 10.3390/ijms19020406.

Inhibition of GLO1 in Glioblastoma Multiforme Increases DNA-AGEs, Stimulates RAGE Expression, and Inhibits Brain Tumor Growth in Orthotopic Mouse Models

Affiliations

Inhibition of GLO1 in Glioblastoma Multiforme Increases DNA-AGEs, Stimulates RAGE Expression, and Inhibits Brain Tumor Growth in Orthotopic Mouse Models

Rahul Jandial et al. Int J Mol Sci. .

Abstract

Cancers that exhibit the Warburg effect may elevate expression of glyoxylase 1 (GLO1) to detoxify the toxic glycolytic byproduct methylglyoxal (MG) and inhibit the formation of pro-apoptotic advanced glycation endproducts (AGEs). Inhibition of GLO1 in cancers that up-regulate glycolysis has been proposed as a therapeutic targeting strategy, but this approach has not been evaluated for glioblastoma multiforme (GBM), the most aggressive and difficult to treat malignancy of the brain. Elevated GLO1 expression in GBM was established in patient tumors and cell lines using bioinformatics tools and biochemical approaches. GLO1 inhibition in GBM cell lines and in an orthotopic xenograft GBM mouse model was examined using both small molecule and short hairpin RNA (shRNA) approaches. Inhibition of GLO1 with S-(p-bromobenzyl) glutathione dicyclopentyl ester (p-BrBzGSH(Cp)₂) increased levels of the DNA-AGE N²-1-(carboxyethyl)-2'-deoxyguanosine (CEdG), a surrogate biomarker for nuclear MG exposure; substantially elevated expression of the immunoglobulin-like receptor for AGEs (RAGE); and induced apoptosis in GBM cell lines. Targeting GLO1 with shRNA similarly increased CEdG levels and RAGE expression, and was cytotoxic to glioma cells. Mice bearing orthotopic GBM xenografts treated systemically with p-BrBzGSH(Cp)₂ exhibited tumor regression without significant off-target effects suggesting that GLO1 inhibition may have value in the therapeutic management of these drug-resistant tumors.

Keywords: AGEs; CEdG; RAGE; glyoxalase 1; methylglyoxal.


Conflict of interest statement

The authors declare no conflict of interest.

Figures

Figure 1
Figure 1
Glyoxylase 1 (GLO1) and RAGE up-regulation in GBM. (A) Analyses of TCGA Pan-Cancer project RNA-Seq data for GLO1 (6p21.3-p21.1) in 154 GBMs indicated increased mRNA expression relative to normal brain tissues (n = 5). Standard box-plots were applied to visualize the expression distribution for each sample type. The red dots show the average values of each distribution. Fold changes (FC) in gene expression and number of samples (N) are indicated at the bottom. Statistical p-values between groups were calculated using Welch’s t-test; ** p < 0.01, * p < 0.05; (B) GLO1 mRNA expression in GBM correlates with alterations in gene copy number as determined by GISTIC2 analysis. Expression of GLO1 in normal tissues was plotted as reference. Heterozygous deletion: loss of one copy; Low-level amplification: gain of one extra copy; High-level amplification: gain of two or more extra copies; (C) Increased expression (three-fold) of RAGE (AGER) mRNA in GBM relative to normal brain.
Figure 2
Figure 2
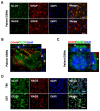
Expression of GLO1 and RAGE in patient GBM tissues and cell lines. (A) Immunofluorescence in patient tumor tissue revealed strong GLO1 and RAGE protein expression (green). GFAP staining (red) indicates tumors of glial origin. Nuclei were stained with DAPI (blue); (B) Orthogonal view through a confocal Z-stack of patient GBM tumor tissue reveals cytoplasmic (c) localization of GLO1 (green) and GFAP (red). Nuclei (n) were stained with DAPI (blue); (C) Confocal Z-stack analysis of RAGE (green) in patient GBM tissue revealed both cytoplasmic (c) and nuclear/perinuclear (n) localization; (D) Immunocytochemistry of T98 and U87 GBM cells revealed co-expression of GLO1 (green) and RAGE (red) protein. Nuclei were stained with DAPI (blue). Scale bars represent 40 µm; (E) GLO1 mRNA expression levels in T98 and U87 GBM cells were determined by RT-qPCR, normalized to β-actin and compared to astrocyte controls; (F) Western blot analysis and quantification revealed GLO1 and RAGE protein levels in T98 and U87 cells relative to astrocytes; * p < 0.05, ns = not significant by Student’s t-test.
Figure 2
Figure 2
Expression of GLO1 and RAGE in patient GBM tissues and cell lines. (A) Immunofluorescence in patient tumor tissue revealed strong GLO1 and RAGE protein expression (green). GFAP staining (red) indicates tumors of glial origin. Nuclei were stained with DAPI (blue); (B) Orthogonal view through a confocal Z-stack of patient GBM tumor tissue reveals cytoplasmic (c) localization of GLO1 (green) and GFAP (red). Nuclei (n) were stained with DAPI (blue); (C) Confocal Z-stack analysis of RAGE (green) in patient GBM tissue revealed both cytoplasmic (c) and nuclear/perinuclear (n) localization; (D) Immunocytochemistry of T98 and U87 GBM cells revealed co-expression of GLO1 (green) and RAGE (red) protein. Nuclei were stained with DAPI (blue). Scale bars represent 40 µm; (E) GLO1 mRNA expression levels in T98 and U87 GBM cells were determined by RT-qPCR, normalized to β-actin and compared to astrocyte controls; (F) Western blot analysis and quantification revealed GLO1 and RAGE protein levels in T98 and U87 cells relative to astrocytes; * p < 0.05, ns = not significant by Student’s t-test.
Figure 3
Figure 3
GLO1 inhibition triggered cell death and apoptosis in GBM cells. (A) IC50 determination following 24 h treatment of U87 and T98 GBM cells with p-BrBzGSH(Cp)2; (B) IC50 curves for treatment of T98 and U87 GBM cells with p-BrBzGSH(Cp)2 following 24 h pretreatment with ADAM10 inhibitor GI254023X (100 µM GIX) or control (0 µM GIX); (C) TUNEL-FITC and DAPI imaging of T98 and U87 GBM after treatment with 30 µM p-BrBzGSH(Cp)2 for 24 h; (D) Quantification of TUNEL fluorescence in p-BrBzGSH(Cp)2 treated T98 and U87 cells normalized to untreated controls. *** p < 0.001. Error bars indicate the mean ± SEM.
Figure 4
Figure 4
GLO1 inhibition induced RAGE expression and increased DNA-AGEs in GBM cells. (A) MS/MS quantification of (R, S) CEdG in T98 and U87 GBM cell lines before (−) and after (+) p-BrBzGSH(Cp)2 treatment (75 and 30 µM, 24 h, respectively). Error bars indicate the mean ± SEM. Data are representative of at least three independent determinations. (B) Expression levels of GLO1 and RAGE mRNA in T98 and U98 cells before (−) and after (+) p-BrBzGSH(Cp)2 treatment (75 and 30 µM, 24 h, respectively). Data represent the mean of at least three independent determinations by RT-qPCR and normalized to β-actin; (C) Quantification of RAGE protein in T98 and U87 GBM cells by immunocytochemical staining following 24 h treatment with p-BrBzGSH(Cp)2, n ≥ 50 cells evaluated per condition. IOD = integrated optical density. **** p <0.0001, ** p < 0.01, * p < 0.05, ns = not significant, by two-way analysis of variance (ANOVA). P values were determined using Tukey’s method when correcting for multiple comparisons; (D) Representative images for colocalization studies in control and GLO1 inhibitor treated T98 and U87 cells revealed intracellular distribution of RAGE: Gate 1, cytoplasmic RAGE (red); Gate 2, nuclei only (blue); Gate 3, perinuclear RAGE. T98 control cells and inset shows cytoplasmic RAGE distribution (red) and scattered perinuclear staining (yellow) for RAGE. T98 cells treated with p-BrBzGSH(Cp)2 displayed enhanced perinuclear RAGE and inset shows intense RAGE staining (yellow) within the perinuclear region.
Figure 4
Figure 4
GLO1 inhibition induced RAGE expression and increased DNA-AGEs in GBM cells. (A) MS/MS quantification of (R, S) CEdG in T98 and U87 GBM cell lines before (−) and after (+) p-BrBzGSH(Cp)2 treatment (75 and 30 µM, 24 h, respectively). Error bars indicate the mean ± SEM. Data are representative of at least three independent determinations. (B) Expression levels of GLO1 and RAGE mRNA in T98 and U98 cells before (−) and after (+) p-BrBzGSH(Cp)2 treatment (75 and 30 µM, 24 h, respectively). Data represent the mean of at least three independent determinations by RT-qPCR and normalized to β-actin; (C) Quantification of RAGE protein in T98 and U87 GBM cells by immunocytochemical staining following 24 h treatment with p-BrBzGSH(Cp)2, n ≥ 50 cells evaluated per condition. IOD = integrated optical density. **** p <0.0001, ** p < 0.01, * p < 0.05, ns = not significant, by two-way analysis of variance (ANOVA). P values were determined using Tukey’s method when correcting for multiple comparisons; (D) Representative images for colocalization studies in control and GLO1 inhibitor treated T98 and U87 cells revealed intracellular distribution of RAGE: Gate 1, cytoplasmic RAGE (red); Gate 2, nuclei only (blue); Gate 3, perinuclear RAGE. T98 control cells and inset shows cytoplasmic RAGE distribution (red) and scattered perinuclear staining (yellow) for RAGE. T98 cells treated with p-BrBzGSH(Cp)2 displayed enhanced perinuclear RAGE and inset shows intense RAGE staining (yellow) within the perinuclear region.
Figure 5
Figure 5
Knockdown of GLO1 induced RAGE expression and increased DNA-AGEs in GBM cells. (A) RT-qPCR analysis showed the efficiency of GLO1 knockdown in increasing RAGE transcripts in GBM cells. mRNA expression levels were normalized to β-actin and untreated cells, and compared with sh-NT cells. sh-NT: non-target short hairpin RNA (shRNA) virus infected cells; shRNA-28 and shRNA-31: GLO1-shRNA-28 and -31 virus infected cells. Data represent the mean of at least three independent determinations; (B) Quantification of (R, S) CEdG adducts in untreated or GLO1 knockdown T98 and U87 cells by LC-ESI-MS/MS. Error bars denote the mean ± SEM. Significant differences are indicated (* p < 0.05, *** p < 0.001, **** p < 0.0001, ns = not significant; two-way ANOVA with Tukey’s method to correct for multiple comparisons).
Figure 6
Figure 6
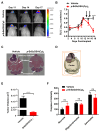
p-BrBzGSH(Cp)2 decreased GBM tumor volume in mice. (A) Representative serial bioluminescence (BLI) acquisition; and (B) quantification over 17 days revealed significant reduction in BLI from xenografted GBM tumors in mice injected intraperitoneally with p-BrBzGSH(Cp)2 vs. vehicle-treated mice (n = 12 per group). Data are mean ± SEM, * p < 0.05, **** p < 0.0001, ns = not significant. Arrows indicate time of drug injections; (C) H&E brain slices of vehicle and p-BrBzGSH(Cp)2-treated mice 17 days post-implant. (D) 3D brain reconstruction for measuring tumor volume in vehicle-treated mice 17 days post-implant; (E) Tumor volume of vehicle and p-BrBzGSH(Cp)2 treated mice 17 days post-implant; (F) Quantification of comparative immunofluorescence in vehicle and p-BrBzGSH(Cp)2 treated animals revealed no increase in apoptotic marker Caspase-3 in neurons, oligodendrocytes, and astrocytes.

Similar articles

Cited by

References

    1. Louis D.N., Perry A., Reifenberger G., von Deimling A., Figarella-Branger D., Cavenee W.K., Ohgaki H., Wiestler O.D., Kleihues P., Ellison D.W. The 2016 world health organization classification of tumors of the central nervous system: A summary. Acta Neuropathol. 2016;131:803–820. doi: 10.1007/s00401-016-1545-1. - DOI - PubMed
    1. Omuro A., DeAngelis L.M. Glioblastoma and other malignant gliomas: A clinical review. JAMA. 2013;310:1842–1850. doi: 10.1001/jama.2013.280319. - DOI - PubMed
    1. Cairns R.A., Harris I.S., Mak T.W. Regulation of cancer cell metabolism. Nat. Rev. 2011;11:85–95. doi: 10.1038/nrc2981. - DOI - PubMed
    1. Ciminera A.K., Jandial R., Termini J. Metabolic advantages and vulnerabilities in brain metastases. Clin. Exp. Metastasis. 2017;34:401–410. doi: 10.1007/s10585-017-9864-8. - DOI - PMC - PubMed
    1. Younes M., Lechago L.V., Somoano J.R., Mosharaf M., Lechago J. Wide expression of the human erythrocyte glucose transporter glut1 in human cancers. Cancer Res. 1996;56:1164–1167. - PubMed

MeSH terms