

Antidepressants, sertraline and paroxetine, increase calcium influx and induce mitochondrial damage-mediated apoptosis of astrocytes
- PMID: 29383176
- PMCID: PMC5777788
- DOI: 10.18632/oncotarget.23302
Antidepressants, sertraline and paroxetine, increase calcium influx and induce mitochondrial damage-mediated apoptosis of astrocytes
Abstract
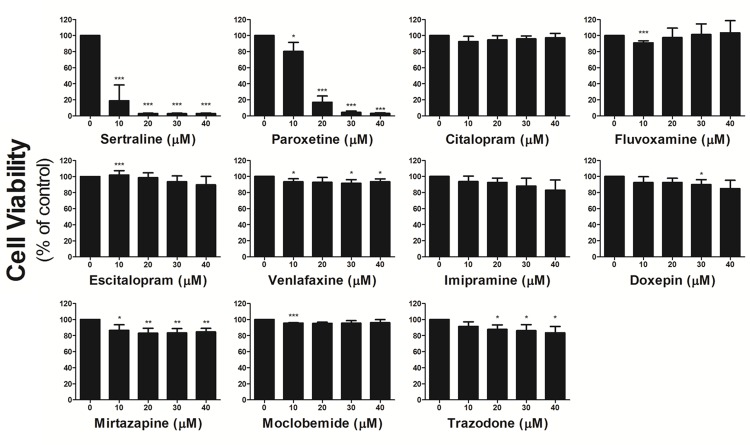
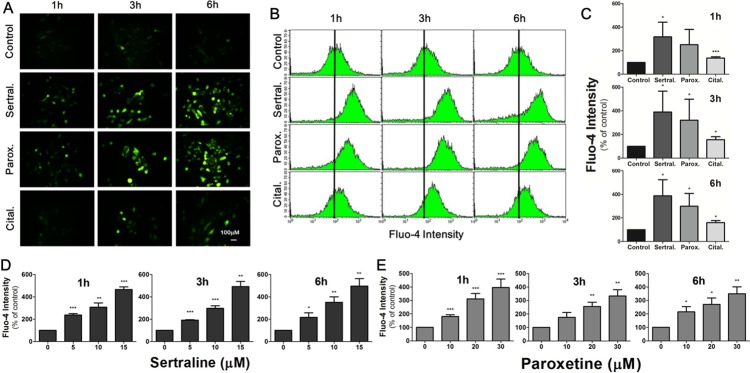
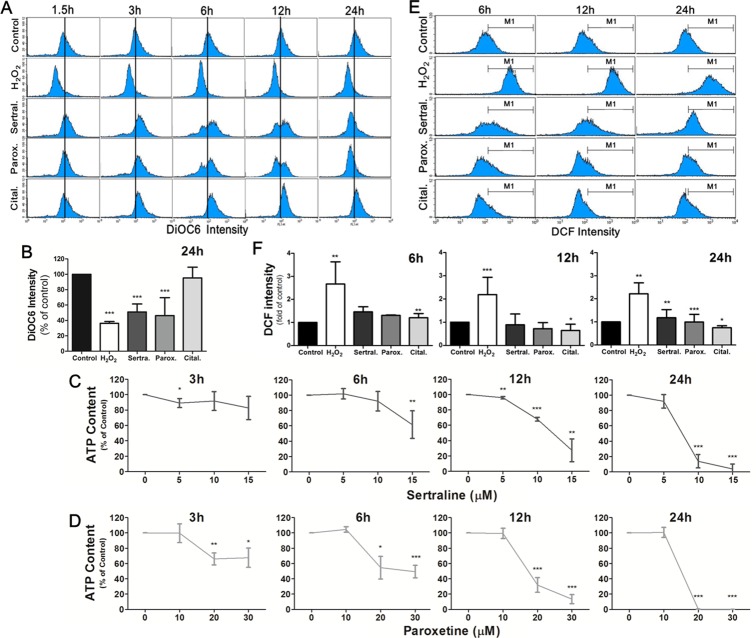
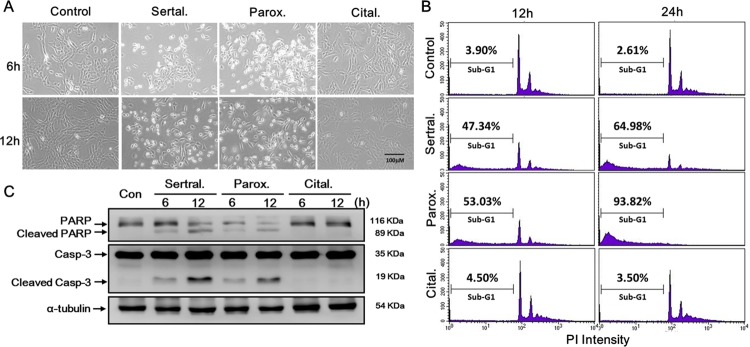
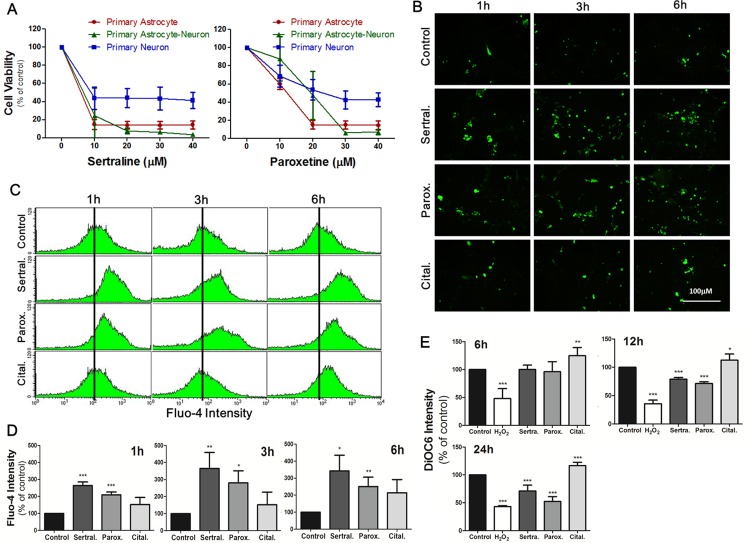
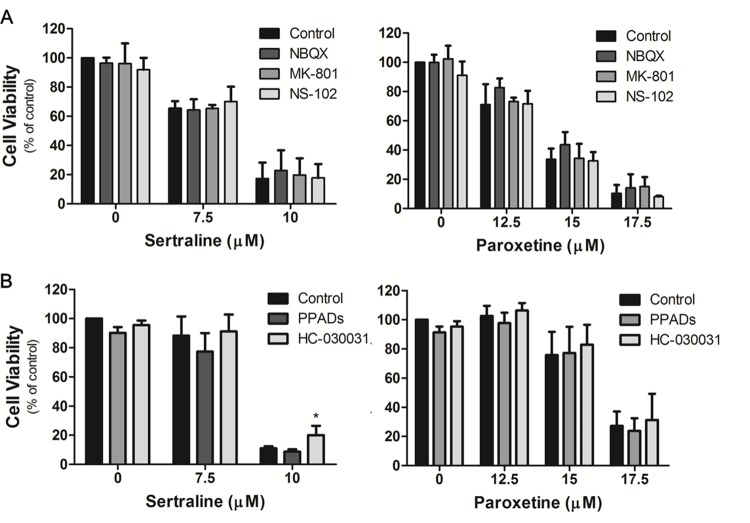
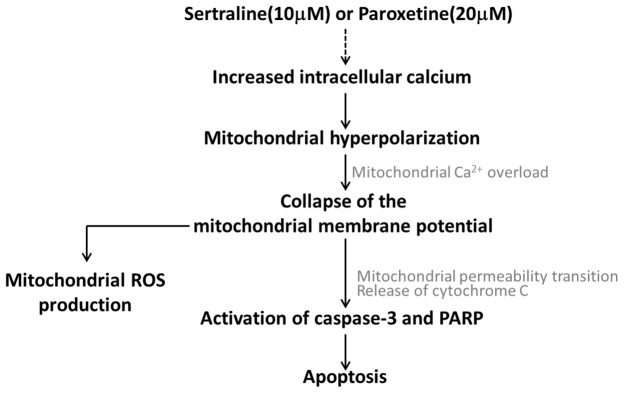
The impacts of antidepressants on the pathogenesis of dementia remain unclear despite depression and dementia are closely related. Antidepressants have been reported may impair serotonin-regulated adaptive processes, increase neurological side-effects and cytotoxicity. An 'astroglio-centric' perspective of neurodegenerative diseases proposes astrocyte dysfunction is involved in the impairment of proper central nervous system functioning. Thus, defining whether antidepressants are harmful to astrocytes is an intriguing issue. We used an astrocyte cell line, primary cultured astrocytes and neuron cells, to identify the effects of 11 antidepressants which included selective serotonin reuptake inhibitors, a serotonin-norepinephrine reuptake inhibitor, tricyclic antidepressants, a tetracyclic antidepressant, a monoamine oxide inhibitor, and a serotonin antagonist and reuptake inhibitor. We found that treatment with 10 μM sertraline and 20 μM paroxetine significantly reduced cell viability. We further explored the underlying mechanisms and found induction of the [Ca2+]i level in astrocytes. We also revealed that sertraline and paroxetine induced mitochondrial damage, ROS generation, and astrocyte apoptosis with elevation of cleaved-caspase 3 and cleaved-PARP levels. Ultimately, we validated these mechanisms in primary cultured astrocytes and neuron cells and obtained consistent results. These results suggest that sertraline and paroxetine cause astrocyte dysfunction, and this impairment may be involved in the pathogenesis of neurodegenerative diseases.
Keywords: antidepressants; astrocyte apoptosis; calcium overload; mitochondrial damage.
Conflict of interest statement
CONFLICTS OF INTEREST We have confirmed that there are no known conflicts of interest associated with this publication.
Figures
Similar articles
-
Antidepressants induce toxicity in human placental BeWo cells.Curr Res Toxicol. 2022 May 6;3:100073. doi: 10.1016/j.crtox.2022.100073. eCollection 2022. Curr Res Toxicol. 2022. PMID: 35602006 Free PMC article.
-
Effect of diclofenac and antidepressants on the inflammatory response in astrocyte cell culture.Inflammopharmacology. 2013 Dec;21(6):421-5. doi: 10.1007/s10787-013-0181-9. Epub 2013 Jul 30. Inflammopharmacology. 2013. PMID: 23896940
-
Effect of co-administration of varenicline and antidepressants on extracellular monoamine concentrations in rat prefrontal cortex.Neurochem Int. 2011 Jan;58(1):78-84. doi: 10.1016/j.neuint.2010.10.015. Epub 2010 Nov 5. Neurochem Int. 2011. PMID: 21056607
-
The pharmacologic profile of paroxetine, a new selective serotonin reuptake inhibitor.J Clin Psychiatry. 1992 Feb;53 Suppl:7-12. J Clin Psychiatry. 1992. PMID: 1531829 Review.
-
Clinical overview of serotonin reuptake inhibitors.J Clin Psychiatry. 1990 Dec;51 Suppl B:9-12. J Clin Psychiatry. 1990. PMID: 2147922 Review.
Cited by
-
Circulating cell-free mitochondrial DNA levels and glucocorticoid sensitivity in a cohort of male veterans with and without combat-related PTSD.Transl Psychiatry. 2024 Jan 10;14(1):22. doi: 10.1038/s41398-023-02721-x. Transl Psychiatry. 2024. PMID: 38200001 Free PMC article.
-
MADD-like pattern of acylcarnitines associated with sertraline use.Mol Genet Metab Rep. 2024 Sep 16;41:101142. doi: 10.1016/j.ymgmr.2024.101142. eCollection 2024 Dec. Mol Genet Metab Rep. 2024. PMID: 39318848 Free PMC article.
-
Upregulation of S100A8 in peripheral blood mononuclear cells from patients with depression treated with SSRIs: a pilot study.Proteome Sci. 2023 Dec 4;21(1):23. doi: 10.1186/s12953-023-00224-7. Proteome Sci. 2023. PMID: 38049858 Free PMC article.
-
Antidepressant Sertraline Hydrochloride Inhibits the Growth of HER2+ AU565 Breast Cancer Cell Line through Induction of Apoptosis and Cell Cycle Arrest.Anticancer Agents Med Chem. 2024;24(14):1038-1046. doi: 10.2174/0118715206304918240509111700. Anticancer Agents Med Chem. 2024. PMID: 38766835
-
Modulation of ACE2/Ang1-7/Mas and ACE/AngII/AT1 axes affects anticancer properties of sertraline in MCF-7 breast cancer cells.Biochem Biophys Rep. 2024 May 23;38:101738. doi: 10.1016/j.bbrep.2024.101738. eCollection 2024 Jul. Biochem Biophys Rep. 2024. PMID: 38831897 Free PMC article.
References
-
- Araque A, Navarrete M. Glial cells in neuronal network function. Philos Trans R Soc Lond B Biol Sci. 2010;365:2375–81. https://doi.org/10.1098/rstb.2009.0313 - DOI - PMC - PubMed
-
- Mattson MP. Apoptosis in neurodegenerative disorders. Nat Rev Mol Cell Biol. 2000;1:120–9. https://doi.org/10.1038/35040009 - DOI - PubMed
-
- Choonara YE, Pillay V, du Toit LC, Modi G, Naidoo D, Ndesendo VM, Sibambo SR. Trends in the molecular pathogenesis and clinical therapeutics of common neurodegenerative disorders. Int J Mol Sci. 2009;10:2510–57. https://doi.org/10.3390/ijms10062510 - DOI - PMC - PubMed
-
- Martin LJ. Neuronal cell death in nervous system development, disease, and injury (review) Int J Mol Med. 2001;7:455–78. - PubMed
-
- Maragakis NJ, Rothstein JD. Mechanisms of disease: astrocytes in neurodegenerative disease. Nat Clin Pract Neurol. 2006;2:679–89. https://doi.org/10.1038/ncpneuro0355 - DOI - PubMed
LinkOut - more resources
Full Text Sources
Other Literature Sources
Research Materials
Miscellaneous
