Automated mammographic breast density estimation using a fully convolutional network
- PMID: 29363774
- PMCID: PMC7153401
- DOI: 10.1002/mp.12763
Automated mammographic breast density estimation using a fully convolutional network
Abstract
Purpose: The purpose of this study was to develop a fully automated algorithm for mammographic breast density estimation using deep learning.
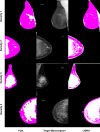
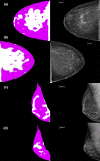
Method: Our algorithm used a fully convolutional network, which is a deep learning framework for image segmentation, to segment both the breast and the dense fibroglandular areas on mammographic images. Using the segmented breast and dense areas, our algorithm computed the breast percent density (PD), which is the faction of dense area in a breast. Our dataset included full-field digital screening mammograms of 604 women, which included 1208 mediolateral oblique (MLO) and 1208 craniocaudal (CC) views. We allocated 455, 58, and 91 of 604 women and their exams into training, testing, and validation datasets, respectively. We established ground truth for the breast and the dense fibroglandular areas via manual segmentation and segmentation using a simple thresholding based on BI-RADS density assessments by radiologists, respectively. Using the mammograms and ground truth, we fine-tuned a pretrained deep learning network to train the network to segment both the breast and the fibroglandular areas. Using the validation dataset, we evaluated the performance of the proposed algorithm against radiologists' BI-RADS density assessments. Specifically, we conducted a correlation analysis between a BI-RADS density assessment of a given breast and its corresponding PD estimate by the proposed algorithm. In addition, we evaluated our algorithm in terms of its ability to classify the BI-RADS density using PD estimates, and its ability to provide consistent PD estimates for the left and the right breast and the MLO and CC views of the same women. To show the effectiveness of our algorithm, we compared the performance of our algorithm against a state of the art algorithm, laboratory for individualized breast radiodensity assessment (LIBRA).
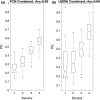
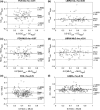
Result: The PD estimated by our algorithm correlated well with BI-RADS density ratings by radiologists. Pearson's rho values of our algorithm for CC view, MLO view, and CC-MLO-averaged were 0.81, 0.79, and 0.85, respectively, while those of LIBRA were 0.58, 0.71, and 0.69, respectively. For CC view and CC-MLO averaged cases, the difference in rho values between the proposed algorithm and LIBRA showed statistical significance (P < 0.006). In addition, our algorithm provided reliable PD estimates for the left and the right breast (Pearson's ρ > 0.87) and for the MLO and CC views (Pearson's ρ = 0.76). However, LIBRA showed a lower Pearson's rho value (0.66) for both the left and right breasts for the CC view. In addition, our algorithm showed an excellent ability to separate each sub BI-RADS breast density class (statistically significant, p-values = 0.0001 or less); only one comparison pair, density 1 and density 2 in the CC view, was not statistically significant (P = 0.54). However, LIBRA failed to separate breasts in density 1 and 2 for both the CC and MLO views (P > 0.64).
Conclusion: We have developed a new deep learning based algorithm for breast density segmentation and estimation. We showed that the proposed algorithm correlated well with BI-RADS density assessments by radiologists and outperformed an existing state of the art algorithm.
Keywords: breast density; deep learning; mammography; segmentation.
© 2018 American Association of Physicists in Medicine.
Figures


Similar articles
-
Determination of mammographic breast density using a deep convolutional neural network.Br J Radiol. 2019 Jan;92(1093):20180691. doi: 10.1259/bjr.20180691. Epub 2018 Oct 1. Br J Radiol. 2019. PMID: 30209957 Free PMC article.
-
Understanding Clinical Mammographic Breast Density Assessment: a Deep Learning Perspective.J Digit Imaging. 2018 Aug;31(4):387-392. doi: 10.1007/s10278-017-0022-2. J Digit Imaging. 2018. PMID: 28932980 Free PMC article.
-
A new method for quantitative analysis of mammographic density.Med Phys. 2007 Nov;34(11):4491-8. doi: 10.1118/1.2789407. Med Phys. 2007. PMID: 18072514
-
Supplemental Screening for Breast Cancer in Women With Dense Breasts: A Systematic Review for the U.S. Preventive Service Task Force [Internet].Rockville (MD): Agency for Healthcare Research and Quality (US); 2016 Jan. Report No.: 14-05201-EF-3. Rockville (MD): Agency for Healthcare Research and Quality (US); 2016 Jan. Report No.: 14-05201-EF-3. PMID: 26866210 Free Books & Documents. Review.
-
Mammographic breast density and the risk of breast cancer: A systematic review and meta-analysis.Breast. 2022 Dec;66:62-68. doi: 10.1016/j.breast.2022.09.007. Epub 2022 Sep 26. Breast. 2022. PMID: 36183671 Free PMC article. Review.
Cited by
-
Breast Dense Tissue Segmentation with Noisy Labels: A Hybrid Threshold-Based and Mask-Based Approach.Diagnostics (Basel). 2022 Jul 28;12(8):1822. doi: 10.3390/diagnostics12081822. Diagnostics (Basel). 2022. PMID: 36010173 Free PMC article.
-
Impact of multi-source data augmentation on performance of convolutional neural networks for abnormality classification in mammography.Front Radiol. 2023 Jun 16;3:1181190. doi: 10.3389/fradi.2023.1181190. eCollection 2023. Front Radiol. 2023. PMID: 37588666 Free PMC article.
-
Neutrosophic segmentation of breast lesions for dedicated breast computed tomography.J Med Imaging (Bellingham). 2018 Jan;5(1):014505. doi: 10.1117/1.JMI.5.1.014505. Epub 2018 Mar 6. J Med Imaging (Bellingham). 2018. PMID: 29541650 Free PMC article.
-
Spatial Correlation and Breast Cancer Risk.Biomed Phys Eng Express. 2019 Jul;5(4):045007. doi: 10.1088/2057-1976/ab1dad. Epub 2019 May 22. Biomed Phys Eng Express. 2019. PMID: 33304615 Free PMC article.
-
Multichannel DenseNet Architecture for Classification of Mammographic Breast Density for Breast Cancer Detection.Front Public Health. 2022 Apr 25;10:885212. doi: 10.3389/fpubh.2022.885212. eCollection 2022. Front Public Health. 2022. PMID: 35548086 Free PMC article.
References
-
- Tabár L, Vitak B, Chen HH, Yen MF, Duffy SW, Smith RA. Beyond randomized controlled trials: organized mammographic screening substantially reduces breast carcinoma mortality. Cancer. 2001;91:1724–1731. - PubMed
-
- Mandelson MT, Oestreicher N, Porter PL, et al. Breast density as a predictor of mammographic detection: comparison of interval‐ and screen‐detected cancers. J Natl Cancer Inst. 2000;92:1081–1087. - PubMed
-
- Boyd NF, Guo H, Martin LJ, et al. Mammographic density and the risk and detection of breast cancer. N Engl J Med. 2007;356:227–236. - PubMed
-
- Sickles EA, D'Orsi CJ, Bassett LW. ACR BI‐RADS® mammography. In: D'Orsi CJ, eds. ACR BI‐RADS® Atlas: Breast Imaging Reporting and Data System. Reston, VA: American College of Radiology; 2013.
MeSH terms
Grants and funding
LinkOut - more resources
Full Text Sources
Other Literature Sources

