. 2018 Jan 22;8(1):1381.
doi: 10.1038/s41598-018-19794-0.

New functions of Semaphorin 3E and its receptor PlexinD1 during developing and adult hippocampal formation

Affiliations

New functions of Semaphorin 3E and its receptor PlexinD1 during developing and adult hippocampal formation

Agata Mata et al. Sci Rep. .

Abstract

The development and maturation of cortical circuits relies on the coordinated actions of long and short range axonal guidance cues. In this regard, the class 3 semaphorins and their receptors have been seen to be involved in the development and maturation of the hippocampal connections. However, although the role of most of their family members have been described, very few data about the participation of Semaphorin 3E (Sema3E) and its receptor PlexinD1 during the development and maturation of the entorhino-hippocampal (EH) connection are available. In the present study, we focused on determining their roles both during development and in adulthood. We determined a relevant role for Sema3E/PlexinD1 in the layer-specific development of the EH connection. Indeed, mice lacking Sema3E/PlexinD1 signalling showed aberrant layering of entorhinal axons in the hippocampus during embryonic and perinatal stages. In addition, absence of Sema3E/PlexinD1 signalling results in further changes in postnatal and adult hippocampal formation, such as numerous misrouted ectopic mossy fibers. More relevantly, we describe how subgranular cells express PlexinD1 and how the absence of Sema3E induces a dysregulation of the proliferation of dentate gyrus progenitors leading to the presence of ectopic cells in the molecular layer. Lastly, Sema3E mutant mice displayed increased network excitability both in the dentate gyrus and the hippocampus proper.


Conflict of interest statement

The authors declare that they have no competing interests.

Figures

Figure 1
Figure 1
Low-power photomicrographs illustrating the distribution of Np1 (a,g,m); Np2 (b,h,n); PlnxD1 (c,i,o); Sema3A (d,j,p); Sema3F (e,k,q) and Sema3E (f,l,r) mRNA in the hippocampal formation and adjacent ventrolateral cortex at E14.5 (a–f), E16.5 (g–l) and P0 (m–r). The different regional boundaries are circumscribed by dashed lines. Characteristic corticofugal, entorhino-hippocampal, subiculo-entorhinal and commissural afferent connections are labelled in red, blue, green and pink respectively in the scheme. Note the absence of Np1 labelling in the ventrolateral cortex at E14.5 and E16.5 (arrows in a and g), compared to Np2 (arrows in b and h) and PlnxD1 (c and i). Sema3A levels in the ventrolateral neocortex were intense at E16.5 (arrows in j). In addition, Sema3E levels in lower layers of both the ventrolateral and entorhinal cortices can be seen from E16.5 onwards (arrows in l). Surprisingly, the subicular region was almost absent of semaphorin labelling (asterisk in pr). Abbreviations: DG = dentate gyrus; EC = entorhinal cortex; H = hippocampus proper; PaS = parasubiculum; PCL = pyramidal cell layer; S = subiculum; VC = ventrolateral neocortex. Scale bars: a = 250 μm pertains to (bf); g = 250 μm pertains to (hl) and m = 100 μm pertains to (nr).
Figure 2
Figure 2
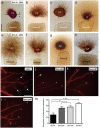
Low-power photomicrographs showing examples of the chemorepulsion of hippocampal (a,b,h), entorhinal (c), ventrolateral (d and f) and dorsal (e and g) axons by Sema3A, Sema3F and Sema3E. Explants were obtained at E14.5 (a–d) or E16.5 (e–h), cultured for 2 days in vitro (DIV) and processed for βIII-tubulin (clone TUJ-1) immunostaining. (a) Dotted line defines the boundary between the proximal (P) and the distal (D) quadrant of the explants. Note the strong chemorepulsion of hippocampal axons by Sema3A at E14.5. In addition, Sema3E-mediated chemorepulsion can be seen on hippocampal, entorhinal and ventrolateral cortex at E14.5 (b–d). Examples of Sema3F-mediated chemorepulsion on ventrolateral axons and Sema3E-effects on hippocampal axons can be seen in f and h respectively. This contrasts with what is observed for dorsal neocortical axons (g). (im) Representative phalloidin-TRITC stained neuronal processes of cultured entorhinal explants from E16.5, illustrating semaphorin-mediated growth cone collapse. (i) Normal growth cones, with lamellipodia and filopodia (arrows) from entorhinal explants cultured with SEAP medium. (jl) Examples of collapsed growth cones (asterisks) after incubation with Sema3A (j), Sema3E (k) and Sema3F (l). (m) Histogram illustrating percentages of collapsed growth cones per explant after the incubation of entorhinal explants with secreted semaphorins. Results represent the mean ± S.E.M. of three separate experiments. Asterisks indicate statistical differences between groups and controls. ***P ≤ 0.001; ANOVA Bonferroni post hoc test. Abbreviations: CA = CA1-3 hippocampal regions; EC = entorhinal cortex; DC = dorsal neocortex; VC = ventrolateral neocortex. Scale bars: a = 150 μm pertains to (bh); i = 20 μm pertains to (jl).
Figure 3
Figure 3
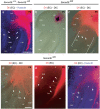
Pattern of entorhino-hippocampal innervations in Sema3E-deficient mice after DiI injections in the entorhinal cortex at P0. (a) In wild-type and Sema3E+/0 mice, entorhinal fibers are restricted to the stratum lacunosum-moleculare (arrows) and the white matter. (bf) In Sema3E0/0 mice the EH connection is formed, but ectopic axons cross the hippocampal fissure, entering the dentate gyrus or the CA1 (arrowheads in bf). Abbreviations as in Fig. 1 and GCL = granule cell layer; h = hilus; HF = hippocampal fissure; PrS = presubiculum; SLM = stratum lacunosum- moleculare. Scale bar: a = 250 μm pertains to (bc); d pertains to (ef) = 100 μm.
Figure 4
Figure 4
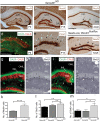
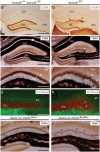
Examples of α-NeuN immunostaining in the hippocampus proper and dentate gyrus of Sema3E0/0 (ac) and Nestin-cre; PlxnD1flox/flox (f) mice at different postnatal stages. Note the presence of numerous NeuN-positive cells in the molecular layer in absence of Sema3E/PlexinD1 signalling (arrowheads), especially in Sema3E-deficient mice. Also note the presence of several waves of the suprapyramidal blade of dentate gyrus. (d) Double immunolabeling of Calretinin (green) and Calbindin (red) in the dentate gyrus of Sema3E0/0 mice at P9. Note the presence of numerous ectopic Calbindin-positive neurons in the IML of Sema3E0/0 mice (arrowheads). (e) Prox-1 immunolabeling in the dentate gyrus of Sema3E0/0 mice at P15 shows the presence of numerous Prox-1-positive granule cells in the molecular layer (arrowheads). (g,i) Double immunolabeling of Calretinin (green) and Calbindin (red) in the dentate gyrus of control (g) and Sema3E0/0 adult mice (i). Note the presence of numerous ectopic Calbindin-positive neurons in the IML of Sema3E0/0 mice (arrows in i). (hj) Examples of BrdU-labeled neurons in the granule cell layer of control (h) and Sema3E0/0 (j) mice. Numerous BrdU-positive cells forming columns in the granule cell layer can be seen in mutant mice (arrows in j). (k) Histogram illustrating the number of NeuN-positive cells in the IML of the suprapyramidal blade of the dentate gyrus in Sema3E+/0 and Sema3E0/0 mice. (lm) Histograms illustrating the number of BrdU-positive cells counted in the whole granule cell layer (l) and in the outer portion of the granule cell layer of the dentate gyrus (labeled as ‘o’) (m) in Sema3E+/+, Sema3E+/0 and Sema3E0/0 mice. Asterisks indicate statistical differences between groups. *P ≤ 0.05; **P ≤ 0.01; ***P ≤ 0.001; ****P ≤ 0.0001. ANOVA Bonferroni post hoc test. Abbreviations as in Figs 1–3 and i = inner portion of the granule cell layer; IML = inner molecular layer; o = outer portion of the granule cell layer and OML = outer molecular layer. Scale bars: a = b = 500μm; c = f = 500 μm; d = 200 μm; e = 200 μm; g and h = 150 μm pertains to i and j respectively.
Figure 5
Figure 5
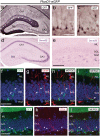
Low- (a) and high- (b,c) power photomicrographs illustrating GFP-positive neurons in the hippocampus (a) and dentate gyrus (b,c) of adult PlxnD1-eGFP mice. Note GFP labelling in subsets of pyramidal neurons CA1 and cells of hilus and subgranular zone. Low- (d) and high- (e) power photomicrographs illustrating the distribution of Sema3E mRNA in the hippocampus (d) and dentate gyrus (e) of adult wild-type mice. (fi) Confocal immunofluorescence images for GFP (green) and GFAP (red) in the dentate gyrus of adult PlxnD1-eGFP mice. Note that all GFP-positive cells express GFAP marker (arrows). (jl) Confocal immunofluorescence images for GFP (green) and DCX (red) in the dentate gyrus of adult PlxnD1-eGFP mice. Note that not all GFP-positive cells express DCX marker (arrowheads). Abbreviations as in Figs 1–4 and ML = molecular layer; SGZ = subgranular zone. Scale bars: a = 500 µm pertains to d; b = 50 µm pertains to c; e = 150 µm; f = 50 µm pertains to (gi); j = 50 µm pertains to (k,l).
Figure 6
Figure 6
(a,b) Examples of α-Calretinin immunostaining in the hippocampus proper and dentate gyrus of adult Sema3E+/+ and Sema3E+/0 (a) and Sema3E0/0 (b) mice. Note the presence of several waves in the IML of the suprapyramidal blade (arrows in b). (c–f) Photomicrographs illustrating the pattern of selenite-silver staining (TIMM) in Sema3E+/0 and Sema3E+/+ (c,e) and Sema3E0/0 (d,f) mice. Note the numerous ectopic mossy fibers crossing the granule cell layer entering the molecular layer of mutant mice (arrows in d,f). (gh) Double immunolabeling of Synaptoporin (SPO, green) and NeuN (red) in the dentate gyrus of Sema3E+/+ and Sema3E+/0 (g) and Sema3E0/0 (h) mice showing ectopic mossy fibers crossing the granule cell layer in mutant mice (arrows in h). (ij) High-power photomicrographs illustrating the pattern of selenite-silver staining (TIMM) in control (Nestin-cre; PlxnD1flox/+) and PlexinD1-deficient (Nestin-cre; PlxnD1flox/flox) mice. Abbreviations as in Figs 1–5 and CALR = calretinin; SPO = synaptoporin. Scale bar: a = 500 μm pertains to b; c = d = 500 μm. e = 150 μm pertains to (f,ij); g = h = 100 μm.
Figure 7
Figure 7
Alterations in the spontaneous oscillatory activity in Sema3E0/0 mice. (a) Representative half coronal section (2.0 mm posterior to Bregma, 1.0 mm lateral from midline) showing the track of a 1 × 16 multichannel recording probe covering the cerebral cortex (CTX) and hippocampus (CA1 and DG) of a mouse. Track reconstruction was accomplished following the tissue deposition of the DiI that was applied to probe prior to insertion. (b) Schematic representation of the 16-multichannel recording probe used to record neuronal activity. (c) Representative examples showing multi-unit activity traces (200–1500 Hz) simultaneously recorded in the cerebral cortex (CTX) and hippocampus (CA1 and DG) of a Sema3E+/+ (black) and a Sema3E0/0 (green) mouse during slow oscillatory activity. No vertical scale because they are arbitrary units (see materials and Methods). (d) Up state durations recorded in the hippocampus (DG and CA1) and cerebral cortex (CTX) of Sema3E+/+ (black, n = 4) and Sema3E0/0 (green, n = 4) mice. Box plots represent the first and third quartiles with the median depicted by the horizontal line within the box and extreme values shown by whiskers. (e) Average excess power (ratio between the mean power spectral density and the fit of the 1/f decay) during local field potential Up states recorded in the hippocampus (DG and CA1) and cerebral cortex (CTX) of Sema3E+/+ (black, n = 4) and Sema3E0/0 (green, n = 4) mice. Data expressed as mean ± S.E.M (shadow). *P < 0.1, **P < 0.05, Wilcoxon rank-sum test. Scale bar: a = 1 mm; b = 100 μm; c = 0.5 s.

Similar articles

Cited by

References

    1. Bird CM. The role of the hippocampus in recognition memory. Cortex. 2017;93:155–165. doi: 10.1016/j.cortex.2017.05.016. - DOI - PubMed
    1. Eichenbaum H. The role of the hippocampus in navigation is memory. J Neurophysiol. 2017;117:1785–1796. doi: 10.1152/jn.00005.2017. - DOI - PMC - PubMed
    1. van Groen T, Miettinen P, Kadish I. The entorhinal cortex of the mouse: organization of the projection to the hippocampal formation. Hippocampus. 2003;13:133–149. doi: 10.1002/hipo.10037. - DOI - PubMed
    1. Taupin, P. The hippocampus: neurotransmission and plasticity in the nervous system (Nova Biomedical Books, 2007).
    1. Amaral DG, Witter MP. The three-dimensional organization of the hippocampal formation: a review of anatomical data. Neuroscience. 1989;31:571–591. doi: 10.1016/0306-4522(89)90424-7. - DOI - PubMed

Publication types

MeSH terms