Lysyl oxidase activates cancer stromal cells and promotes gastric cancer progression: quantum dot-based identification of biomarkers in cancer stromal cells
- PMID: 29343955
- PMCID: PMC5747962
- DOI: 10.2147/IJN.S143871
Lysyl oxidase activates cancer stromal cells and promotes gastric cancer progression: quantum dot-based identification of biomarkers in cancer stromal cells
Abstract
Purpose: Semiconductor quantum dots (QDs) are a promising alternative to organic fluorescent dyes for multiplexed molecular imaging of cancer stroma, which have great advantages in holistically analyzing the complex interactions among cancer stromal components in situ.
Patients and methods: A QD probe-based multiplexed spectral molecular imaging method was established for simultaneous imaging. Three tissue microarrays (TMAs) including 184 gastric cancer (GC) tissues were constructed for the study. Multispectral analyses were performed for quantifying stromal biomarkers, such as lysyl oxidase (LOX). The stromal status including infiltrating of immune cells (high density of macrophages), angiogenesis (high density of microvessel density [MVD], low neovessel maturation) and extracellular matrix (ECM) remodeling (low density of type IV collagen, intense expression of matrix metalloproteinase 9 [MMP-9]) was evaluated.
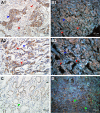
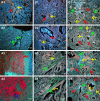
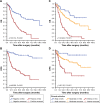
Results: This study compared the imaging features of the QD probe-based single molecular imaging method, immunohistochemistry, and organic dye-based immunofluorescent methods, and showed the advantages of the QD probe-based multiple molecular imaging method for simultaneously visualizing complex components of cancer stroma. The risk of macrophages in high density, high MVD, low neomicrovessel maturation, MMP-9 expression and low type IV collagen was significantly increased for the expression of LOX. With the advantages of the established QD probe-based multiplexed molecular imaging method, the spatial relationship between LOX and stromal essential events could be simultaneously evaluated histologically. Stromal activation was defined and then evaluated. Survival analysis showed that the stromal activation was correlated with overall survival and disease-free survival (P<0.001 for all). The expression of LOX was significantly increased in the intense activation subgroup (P<0.001).
Conclusion: Quantifying assessment of the stroma indicates that the LOX may be a stromal marker for GC and stromal activation, which is not only responsible for the ECM remodeling morphologically, but also for the formation of invasive properties and recurrence. These results support the possibility to integrate morphological and molecular biomarker information for cancer research by the biomedical application of QDs.
Keywords: cancer stromal; gastric cancer; multiplexed molecular imaging; nanomedicine.
Conflict of interest statement
Disclosure The authors report no conflicts of interest in this work.
Figures


Similar articles
-
Coevolution of the tumor microenvironment revealed by quantum dot-based multiplexed imaging of hepatocellular carcinoma.Future Oncol. 2013 Jul;9(7):1029-37. doi: 10.2217/fon.13.63. Future Oncol. 2013. PMID: 23837765
-
Lysyl oxidase and hypoxia-inducible factor 1α: biomarkers of gastric cancer.World J Gastroenterol. 2019 Apr 21;25(15):1828-1839. doi: 10.3748/wjg.v25.i15.1828. World J Gastroenterol. 2019. PMID: 31057297 Free PMC article.
-
Co-evolution of cancer microenvironment reveals distinctive patterns of gastric cancer invasion: laboratory evidence and clinical significance.J Transl Med. 2010 Oct 15;8:101. doi: 10.1186/1479-5876-8-101. J Transl Med. 2010. PMID: 20950454 Free PMC article.
-
Lysyl oxidase isoforms in gastric cancer.Biomark Med. 2016 Sep;10(9):987-98. doi: 10.2217/bmm-2016-0075. Epub 2016 Aug 26. Biomark Med. 2016. PMID: 27564724 Review.
-
Evolving roles of lysyl oxidase family in tumorigenesis and cancer therapy.Pharmacol Ther. 2020 Nov;215:107633. doi: 10.1016/j.pharmthera.2020.107633. Epub 2020 Jul 18. Pharmacol Ther. 2020. PMID: 32693113 Review.
Cited by
-
Clinicopathological and prognostic value of lysyl oxidase expression in gastric cancer: a systematic review, meta-analysis and bioinformatic analysis.Sci Rep. 2022 Oct 6;12(1):16786. doi: 10.1038/s41598-022-21402-1. Sci Rep. 2022. PMID: 36202905 Free PMC article.
-
Role of extra cellular proteins in gastric cancer progression and metastasis: an update.Genes Environ. 2020 May 15;42:18. doi: 10.1186/s41021-020-00157-z. eCollection 2020. Genes Environ. 2020. PMID: 32467737 Free PMC article. Review.
-
In Vivo Toxicity Evaluation of PEGylated CuInS2/ZnS Quantum Dots in BALB/c Mice.Front Pharmacol. 2019 Apr 25;10:437. doi: 10.3389/fphar.2019.00437. eCollection 2019. Front Pharmacol. 2019. PMID: 31080414 Free PMC article.
-
New Gene Markers of Angiogenesis and Blood Vessels Development in Porcine Ovarian Granulosa Cells during Short-Term Primary Culture In Vitro.Biomed Res Int. 2019 Jan 30;2019:6545210. doi: 10.1155/2019/6545210. eCollection 2019. Biomed Res Int. 2019. PMID: 30834271 Free PMC article.
-
Iduronate-2-Sulfatase-Regulated Dermatan Sulfate Levels Potentiate the Invasion of Breast Cancer Epithelia through Collagen Matrix.J Clin Med. 2019 Sep 30;8(10):1562. doi: 10.3390/jcm8101562. J Clin Med. 2019. PMID: 31574977 Free PMC article.
References
-
- Wegner KD, Hildebrandt N. Quantum dots: bright and versatile in vitro and in vivo fluorescence imaging biosensors. Chem Soc Rev. 2015;44(14):4792–4834. - PubMed
-
- Lee-Montiel FT, Li P, Imoukhuede PI. Quantum dot multiplexing for the profiling of cellular receptors. Nanoscale. 2015;7(44):18504–18514. - PubMed
MeSH terms
Substances
LinkOut - more resources
Full Text Sources
Other Literature Sources
Medical
Miscellaneous

