. 2018 Jan 16;9(1):245.
doi: 10.1038/s41467-017-02068-0.

TGR5 signalling promotes mitochondrial fission and beige remodelling of white adipose tissue

Affiliations

TGR5 signalling promotes mitochondrial fission and beige remodelling of white adipose tissue

Laura A Velazquez-Villegas et al. Nat Commun. .

Abstract

Remodelling of energy storing white fat into energy expending beige fat could be a promising strategy to reduce adiposity. Here, we show that the bile acid-responsive membrane receptor TGR5 mediates beiging of the subcutaneous white adipose tissue (scWAT) under multiple environmental cues including cold exposure and prolonged high-fat diet feeding. Moreover, administration of TGR5-selective bile acid mimetics to thermoneutral housed mice leads to the appearance of beige adipocyte markers and increases mitochondrial content in the scWAT of Tgr5 +/+ mice but not in their Tgr5 -/- littermates. This phenotype is recapitulated in vitro in differentiated adipocytes, in which TGR5 activation increases free fatty acid availability through lipolysis, hence fuelling β-oxidation and thermogenic activity. TGR5 signalling also induces mitochondrial fission through the ERK/DRP1 pathway, further improving mitochondrial respiration. Taken together, these data identify TGR5 as a druggable target to promote beiging with potential applications in the management of metabolic disorders.


Conflict of interest statement

The authors declare no competing financial interests.

Figures
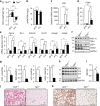
Fig. 1
Fig. 1
TGR5 is required for cold-induced scWAT beiging. a Body weight gain of TGR5 wild-type (Tgr5+/+) and germline TGR5 knockout (Tgr5−/−) mice housed at thermoneutrality (30 °C) or exposed to cold (8 °C) for 7 days. n = 10 per group. b scWAT over body weight (BW) ratio of mice described in a. ce mRNA levels of beige remodelling markers Ucp1 (c), Cidea (d), Pgc1a, Tbx1, Prdm16, Cd137, Pparg2 and Cebpb (e) in the scWAT of mice described in a. f Representative (n = 10 per group) western blot of PGC-1α, the mitochondrial marker VDAC1 and beiging markers TBX1 and UCP1 from the scWAT of cold-exposed mice described in a. GAPDH was used as loading control. g Quantitative densitometry of the western blots showed in f. h Representative (n = 10 per group) western blot of mitochondrial OXPHOS complexes (CII–CV) from the scWAT of cold-exposed mice described in a, GAPDH was used as loading control. i Quantification of mitochondrial (16S) vs. nuclear (HK2) DNA ratio from the scWAT of cold-exposed mice described in a. j, k Representative haematoxylin and eosin (j) and UCP1 (k) stainings of scWAT sections from cold-exposed mice described in a. Scale bars = 50 μm. Results represent mean ± SEM. *P ≤ 0.05, **P ≤ 0.01 and ***P ≤ 0.001 vs. Tgr5+/+ group (at 30 and/or 8 °C) by one-way ANOVA followed by Bonferroni post hoc test (ae) or Student’s t-test (g, i). Uncropped western blots are provided in Supplementary Fig. 9A–C
Fig. 2
Fig. 2
Adipocyte TGR5 is required for cold-induced scWAT beiging. a Body temperature of control mice (Tgr5Adipoq+/+) and WAT-specific TGR5 knockout (Tgr5Adipoq−/−) mice exposed to cold (8 °C) for 7 days. n = 10 per group. b Representative (n = 5 per group) haematoxylin and eosin stainings of scWAT of mice described in a. ce mRNA levels of beige remodelling markers Ucp1 (c) Pgc1a, Tbx1, Cidea and Pparg2 (d), and Prdm16, Cd137 and Cebpb (e) in the scWAT of Tgr5Adipoq+/+ and Tgr5Adipoq−/− mice housed at thermoneutrality (30 °C) or exposed to cold (8 °C) for 7 days. n = 10 per group. f Representative (n = 10 per group) western blot of PGC-1α, the mitochondrial marker VDAC1 and beiging markers TBX1 and UCP1 from the scWAT of mice described in a. GAPDH was used as loading control. g Quantitative densitometry of the western blots showed in f. h Representative (n = 5 per group) UCP1 staining of scWAT sections from mice described in a. Scale bars = 50 μm. i Quantification of mitochondrial (16S) vs. nuclear (HK2) DNA ratio from the scWAT of mice described in a. Results represent mean ± SEM. *P ≤ 0.05, **P ≤ 0.01 and ***P ≤ 0.001 vs. Tgr5Adipoq+/+ group (at 30 and/or 8 °C) by one-way ANOVA (ce) and two-way ANOVA (a) followed by Bonferroni post hoc test or Student’s t test (g, i). Uncropped western blots are provided in Supplementary Fig. 10A–E
Fig. 3
Fig. 3
TGR5 activation induces scWAT beiging at thermoneutrality. a Body weight gain of TGR5 wild-type (Tgr5+/+) and germline TGR5 knockout (Tgr5−/−) mice housed at thermoneutrality (30 °C) and subjected to a daily administration of the selective TGR5 agonist INT-777 or vehicle for 7 days. n = 10 per group. b scWAT over body weight (BW) ratio of the mice described in a. c, d mRNA levels of beige remodelling markers Ucp1 and Cidea (c), Pgc1a, Tbx1, Prdm16, and Cd137, Pparg2 and Cebpb; Tgr5 and adrenergic related genes (Adrb3 and Th) (d) in the scWAT of mice described in a. e Representative (n = 10 per group) western blot of PGC-1α, the mitochondrial marker VDAC1, and beiging markers TBX1 and UCP1 from the scWAT of mice described in a. GAPDH was used as loading control. f Representative (n = 5 per group) UCP1 immunostaining of scWAT sections from mice described in a. Scale bars = 50 μm. Results represent mean ± SEM. *P ≤ 0.05, **P ≤ 0.01 and ***P ≤ 0.001 vs. Tgr5+/+ + Vehicle group by one-way ANOVA followed by Bonferroni post hoc test. Uncropped western blots are provided in Supplementary Fig. 11A–D
Fig. 4
Fig. 4
TGR5 activation induces scWAT beiging in mice fed a high-fat diet. a Body weight curves of TGR5 wild-type (Tgr5+/+) fed a high-fat (HF) diet for 20 weeks in the presence or absence of the selective TGR5 agonist INT-777. n = 10 per group. b mRNA levels of beige remodelling markers Pgc1a, Ucp1, Tbx1, Prdm16, Cidea, Cd137, Pparg2 and Cebpb in the scWAT of mice described in a. c Representative (n = 10 per group) western blot of PGC-1α, the mitochondrial marker VDAC1, and beiging markers TBX1 and UCP1 from the scWAT of mice described in a. GAPDH was used as loading control. d Quantification of mitochondrial (16S) vs. nuclear (HK2) DNA ratio from the scWAT of mice described in a. e Representative haematoxylin and eosin staining from the scWAT of mice described in a. f Adipocyte area quantification from images shown in e. g Representative (n = 5 per group) UCP1 immunostaining of scWAT sections from mice described in a. h Quantification of UCP1 immunostaining intensity depicted in g. Scale bars = 50 μm. Results represent mean ± SEM. *P ≤ 0.05 and **P ≤ 0.01 vs. Tgr5+/+ HF group by two-way ANOVA followed by Bonferroni post hoc test (a) or Student’s t test (b, d, h). Uncropped western blots are provided in Supplementary Fig. 12A and B
Fig. 5
Fig. 5
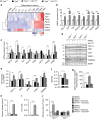
TGR5 activation promotes beige adipocyte differentiation in vitro. a Heat map showing the expression of Tgr5 and adipocyte and beiging markers from human bone marrow-derived mesenchymal stem cells induced for adipogenic differentiation (GEO Accession number GSE80614). Colour key represents row z-score. b mRNA levels of beige remodelling markers Pgc1a, Ucp1, Tbx1, Prdm16, Cidea, Cd137, Pparg2 and Cebpb assessed in the human pre-adipocyte cell line, Simpson Golabi Behmel Syndrome (SGBS). SGBS cells were differentiated in presence or absence of the TGR5 agonist INT-777. n = 6. c mRNA levels of genes described in b in adipocytes differentiated from the stromal vascular fraction (SVF) of TGR5 wild-type (Tgr5+/+) and germline TGR5 knock-out (Tgr5−/−) mice. SVF cells were differentiated for 7 days in presence or absence of the TGR5 agonist INT-777. n = 6. d Representative (n = 6 per group) western blot of PGC-1α, mitochondrial markers (VDAC1 and TOMM40) and beiging markers TBX1 and UCP1 from the cells described in c. PARP1 was used as loading control. e Quantitative densitometry of the western blots showed in d. f Quantification of mitochondrial (16S) vs. nuclear (HK2) DNA ratio from the cells described in c. g Spare respiratory capacity of the cells described in c, calculated as the difference between maximal (FCCP) and basal oxygen consumption rate (OCR). h, i Glycerol (h) and fatty acid (i) release from the cells described in c after 1 h stimulation with the TGR5 agonist INT-777 or vehicle (DMSO). j Basal oxygen consumption rate (OCR) of cells described in c after 3 h pre-incubation with etomoxir and stimulation with the TGR5 agonist INT-777 or vehicle (DMSO). Results represent mean ± SEM. *P ≤ 0.05, **P ≤ 0.01 and ***P ≤ 0.001 vs. Tgr5+/+ cells by one-way ANOVA followed by Bonferroni post hoc test (c, ej) or Student’s t test (b). Uncropped western blots are provided in Supplementary Fig. 13A–C and Supplementary Fig. 14A
Fig. 6
Fig. 6
TGR5 activation induces mitochondrial fission in an ERK-DRP1-dependent manner. a, c Representative (n = 6 per group) images of TOMM20 immunofluorescence (in green) on preadipocytes (a) and differentiated adipocytes (c) derived from the stromal vascular fraction (SVF) of TGR5 wild-type (Tgr5+/+) and germline TGR5 knockout (Tgr5−/−) mice and stimulated with the TGR5 agonist INT-777 or vehicle (DMSO). Nuclei were stained with DAPI (in blue). Scale bars = 10 μm (a) 25 μm (c). Insets show higher magnification of the reconstructed mitochondrial network (ImageJ program). b, d Quantification of mitochondrial circularity from images as in a and c calculated with ImageJ. n = 6. e, f Representative (n = 6 per group) western blots of TGR5 downstream targets (phospho proteins), their relative controls (CREB, ERK and DRP1) and the mitochondrial protein MFF from the total extract (e) or isolated mitochondria (f) derived from differentiated adipocytes described in c. PARP1 (e) and VDAC1 (f) were used as loading controls. n = 6. Results represent mean ± SEM. **P ≤ 0.01 and ***P ≤ 0.001 vs. Tgr5+/+ cells by one-way ANOVA followed by Bonferroni post hoc test. Uncropped western blots are provided in Supplementary Fig. 13D and E and Supplementary Fig. 14B–E
Fig. 7
Fig. 7
ERK activation is required for TGR5-mediated mitochondrial fission. a, b Representative (n = 6 per group) western blots of PGC-1α, the mitochondrial marker VDAC1, and beiging markers TBX1 and UCP1, and TGR5 downstream targets (phospho proteins) with their relative controls (CREB, ERK and DRP1) from differentiated adipocytes derived from the stromal vascular fraction (SVF) of TGR5 wild-type (Tgr5+/+) (a) and germline TGR5 knockout (Tgr5−/−) (b) mice. PARP1 was used as loading control. Cells were stimulated with the TGR5 agonist INT-777 or vehicle (DMSO) in the presence or absence of the selective ERK inhibitor FR180204. n = 6. c Representative (n = 6 per group) images of TOMM20 immunofluorescence (in green) on preadipocytes derived from the stromal vascular fraction (SVF) of TGR5 wild-type (Tgr5+/+) and germline TGR5 knockout (Tgr5−/−) mice. Cells were stimulated as described in a and b. Nuclei were stained with DAPI (in blue). Scale bars = 10 μm. Insets show a reconstruction of the mitochondrial network. n = 6. d Oxygen consumption rate (OCR) of the cells described in a and b. Cellular respiration was measured in basal condition (Basal) and at maximal respiration (FCCP). Results represent mean ± SEM. **P ≤ 0.01 and ***P ≤ 0.001 vs. Tgr5+/+ cells by one-way ANOVA followed by Bonferroni post hoc test. Uncropped western blots are provided in Supplementary Fig. 15A–E and Supplementary Fig. 16A–E

Comment in

Similar articles

Cited by

References

    1. Giralt M, Villarroya F. White, brown, beige/brite: different adipose cells for different functions? Endocrinology. 2013;154:2992–3000. doi: 10.1210/en.2013-1403. - DOI - PubMed
    1. Wu J, et al. Beige adipocytes are a distinct type of thermogenic fat cell in mouse and human. Cell. 2012;150:366–376. doi: 10.1016/j.cell.2012.05.016. - DOI - PMC - PubMed
    1. Fedorenko A, Lishko PV, Kirichok Y. Mechanism of fatty-acid-dependent UCP1 uncoupling in brown fat mitochondria. Cell. 2012;151:400–413. doi: 10.1016/j.cell.2012.09.010. - DOI - PMC - PubMed
    1. Matthias A, et al. Thermogenic responses in brown fat cells are fully UCP1-dependent. UCP2 or UCP3 do not substitute for UCP1 in adrenergically or fatty scid-induced thermogenesis. J. Biol. Chem. 2000;275:25073–25081. doi: 10.1074/jbc.M000547200. - DOI - PubMed
    1. Nedergaard J, Cannon B. The Browning of white adipose tissue: some burning issues. Cell Metab. 2014;20:396–407. doi: 10.1016/j.cmet.2014.07.005. - DOI - PubMed

Publication types

MeSH terms

Substances