Stratospheric ozone loss over the Eurasian continent induced by the polar vortex shift
- PMID: 29335470
- PMCID: PMC5768802
- DOI: 10.1038/s41467-017-02565-2
Stratospheric ozone loss over the Eurasian continent induced by the polar vortex shift
Abstract
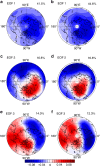
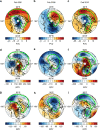
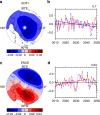
The Montreal Protocol has succeeded in limiting major ozone-depleting substance emissions, and consequently stratospheric ozone concentrations are expected to recover this century. However, there is a large uncertainty in the rate of regional ozone recovery in the Northern Hemisphere. Here we identify a Eurasia-North America dipole mode in the total column ozone over the Northern Hemisphere, showing negative and positive total column ozone anomaly centres over Eurasia and North America, respectively. The positive trend of this mode explains an enhanced total column ozone decline over the Eurasian continent in the past three decades, which is closely related to the polar vortex shift towards Eurasia. Multiple chemistry-climate-model simulations indicate that the positive Eurasia-North America dipole trend in late winter is likely to continue in the near future. Our findings suggest that the anticipated ozone recovery in late winter will be sensitive not only to the ozone-depleting substance decline but also to the polar vortex changes, and could be substantially delayed in some regions of the Northern Hemisphere extratropics.
Conflict of interest statement
The authors declare no competing financial interests.
Figures


Similar articles
-
Improved Global Surface Temperature Simulation using Stratospheric Ozone Forcing with More Accurate Variability.Sci Rep. 2018 Sep 27;8(1):14474. doi: 10.1038/s41598-018-32656-z. Sci Rep. 2018. PMID: 30262911 Free PMC article.
-
Changes in biologically-active ultraviolet radiation reaching the Earth's surface.Photochem Photobiol Sci. 2007 Mar;6(3):218-31. doi: 10.1039/b700017k. Epub 2007 Feb 15. Photochem Photobiol Sci. 2007. PMID: 17344959
-
The dynamics of the stratospheric polar vortex and its relation to springtime ozone depletions.Science. 1991 Jan 4;251(4989):46-52. doi: 10.1126/science.251.4989.46. Science. 1991. PMID: 17778602
-
The extraordinary events of the major, sudden stratospheric warming, the diminutive antarctic ozone hole, and its split in 2002.Environ Sci Pollut Res Int. 2004;11(6):405-11. doi: 10.1007/BF02979661. Environ Sci Pollut Res Int. 2004. PMID: 15603531 Review.
-
Ozone depletion and climate change: impacts on UV radiation.Photochem Photobiol Sci. 2011 Feb;10(2):182-98. doi: 10.1039/c0pp90034f. Epub 2011 Jan 20. Photochem Photobiol Sci. 2011. PMID: 21253660 Review.
Cited by
-
Polar Vortex Multi-Day Intensity Prediction Relying on New Deep Learning Model: A Combined Convolution Neural Network with Long Short-Term Memory Based on Gaussian Smoothing Method.Entropy (Basel). 2021 Oct 8;23(10):1314. doi: 10.3390/e23101314. Entropy (Basel). 2021. PMID: 34682038 Free PMC article.
-
Improved Global Surface Temperature Simulation using Stratospheric Ozone Forcing with More Accurate Variability.Sci Rep. 2018 Sep 27;8(1):14474. doi: 10.1038/s41598-018-32656-z. Sci Rep. 2018. PMID: 30262911 Free PMC article.
References
-
- Van der Leun, J. C., Tang, X. & Tevini, M. Environmental effects of ozone depletion: 1994 assessment. AMBIO-STOCKHOLM-24, 138 (1995).
-
- Longstreth JD, De G, Kripke ML, Takizawa Y, van der Leun JC. Effects of increased solar ultraviolet radiation on human health. Ambio. 1995;24:153–165.
Publication types
LinkOut - more resources
Full Text Sources
Other Literature Sources
Miscellaneous

