

Differential roles of ERRFI1 in EGFR and AKT pathway regulation affect cancer proliferation
- PMID: 29335246
- PMCID: PMC5835844
- DOI: 10.15252/embr.201744767
Differential roles of ERRFI1 in EGFR and AKT pathway regulation affect cancer proliferation
Abstract
AKT signaling is modulated by a complex network of regulatory proteins and is commonly deregulated in cancer. Here, we present a dual mechanism of AKT regulation by the ERBB receptor feedback inhibitor 1 (ERRFI1). We show that in cells expressing high levels of EGFR, ERRF1 inhibits growth and enhances responses to chemotherapy. This is mediated in part through the negative regulation of AKT signaling by direct ERRFI1-dependent inhibition of EGFR In cells expressing low levels of EGFR, ERRFI1 positively modulates AKT signaling by interfering with the interaction of the inactivating phosphatase PHLPP with AKT, thereby promoting cell growth and chemotherapy desensitization. These observations broaden our understanding of chemotherapy response and have important implications for the selection of targeted therapies in a cell context-dependent manner. EGFR inhibition can only sensitize EGFR-high cells for chemotherapy, while AKT inhibition increases chemosensitivity in EGFR-low cells. By understanding these mechanisms, we can take advantage of the cellular context to individualize antineoplastic therapy. Finally, our data also suggest targeting of EFFRI1 in EGFR-low cancer as a promising therapeutic approach.
Keywords: AKT; AKT inhibitor; EGFR; ERRFI1; PHLPP.
© 2018 The Authors. Published under the terms of the CC BY NC ND 4.0 license.
Figures
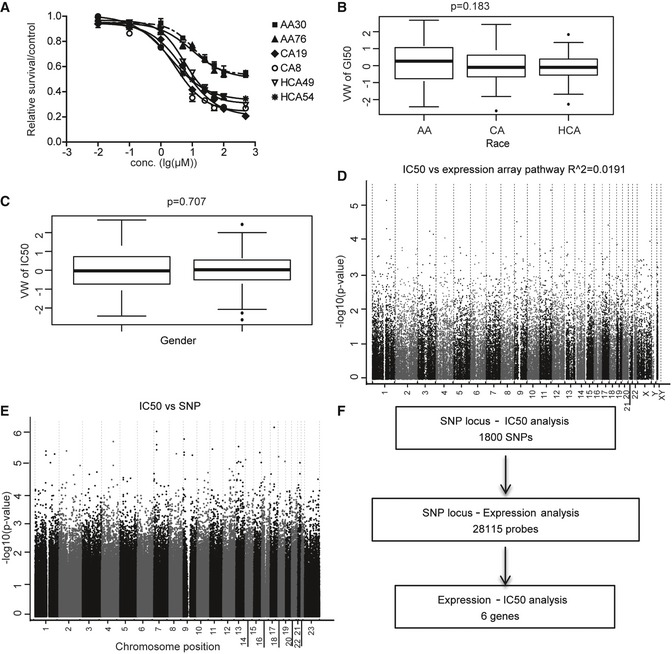
Representative TCN cytotoxicity dose–response curves. Two cell lines from each of the three ethnic groups were selected to illustrate a range of TCN cytotoxicity “dose–response” curves. AA (African Americans), CA (Caucasian Americans), HCA (Han Chinese Americans). The x‐axis indicates TCN dose, and the y‐axis indicates the surviving fraction after TCN exposure. Data represent mean ± SEM of three replicates.
TCN IC50 among three ethnic groups. Horizontal line: median; box limits: first and third quantiles; whiskers: if no points exist reaching beyond 1.5*IQR (inter‐quartile range) of the 1st and 3rd quantiles, then it's the smallest or largest data value, otherwise it is 1st quantile – 1.5*IQR or 3rd quantile + 1.5*IQR; dots: values outside of 1.5*IQR of the 1st and 3rd quantile. Statistical analyses were performed with the F‐test from a linear regression model of gender (1 numerator df) or race (2 numerator df) vs. van der Waerdan transformed IC50.
Gender effect on TCN IC50 values. Horizontal line: median; box limits: first and third quantiles; whiskers: if no points exist reaching beyond 1.5*IQR (inter‐quartile range) of the 1st and 3rd quantiles, then it's the smallest or largest data value, otherwise it is 1st quantile – 1.5*IQR or 3rd quantile + 1.5*IQR; dots: values outside of 1.5*IQR of the 1st and 3rd quantile. Statistical analyses were performed with the F‐test from a linear regression model of gender (1 numerator df) or race (2 numerator df) vs. van der Waerdan transformed IC50.
Association of basal expression with TCN IC50 for 263 LCLs. The y‐axis represents the −log10 (P‐value) for the association of individual expression array probe set. Expression probe sets are plotted on the x‐axis based on the chromosomal locations. If genes had more than one probe set, the one with the lowest P‐value was plotted.
Genomewide SNP association with TCN IC50 for 263 LCLs. The y‐axis represents −log10 (P‐value) for the association of each SNP with TCN IC50. SNPs are plotted on the x‐axis based on their chromosomal locations.
Schematic diagram of the strategy of integrated analysis used to select genes for functional validation.
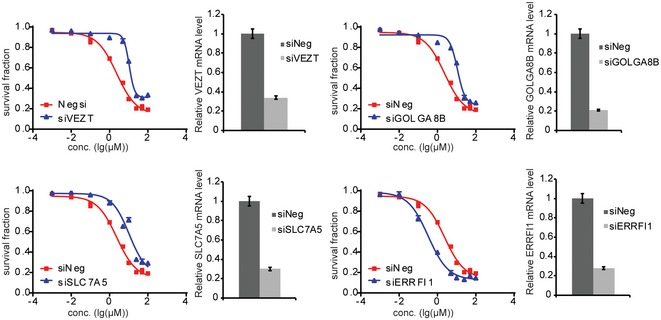
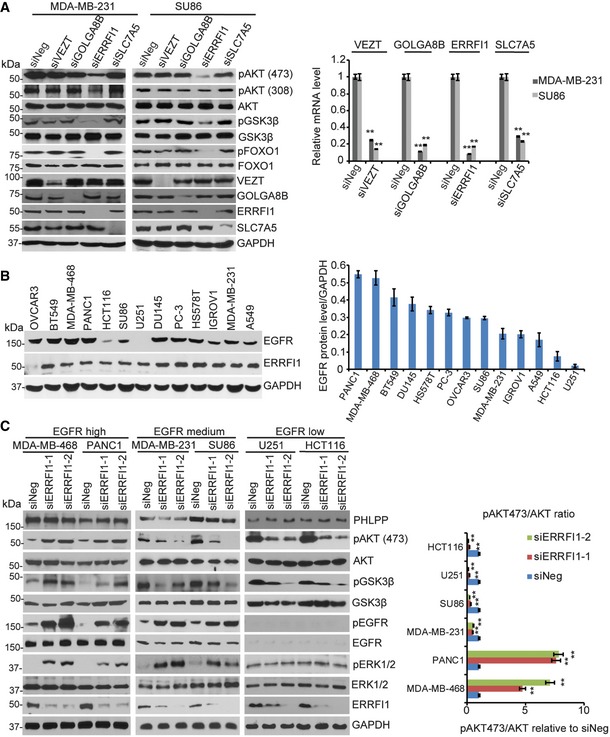
MDA‐MB‐231 and SU86 cells were transfected with negative siRNA (siNeg) or indicated siRNA. Cell lysates were then blotted with the indicated antibodies. The mRNAs were extracted from the rest of the cells and subjected to qRT–PCR to determine knockdown efficiency. Error bars represent the SEM of three independent experiments. **P < 0.01. Statistical analyses were performed with Student's t‐test.
Cell lysates from 13 human cancer cell lines were blotted with anti‐EGFR antibody. Quantification of EGFR protein relative to the GAPDH was determined. Error bars represent the SEM of three independent experiments.
MDA‐MB‐468, PANC1, MDA‐MB‐231, SU86, U251, and HCT116 cells were transfected with two ERRFI1 siRNAs; 48 h later, cell lysates were subjected to Western blot. The ratio of phospho‐AKT473 /total AKT signal (pAKT473/AKT) was quantified using ImageJ. pAKT473/AKT in siNeg is set to 1 within each cell line. Error bars represent ± SEM of three independent experiments. The significant difference between siNeg and siERRFI1 is indicated by: **P < 0.01. Statistical analyses were performed with Student's t‐test.
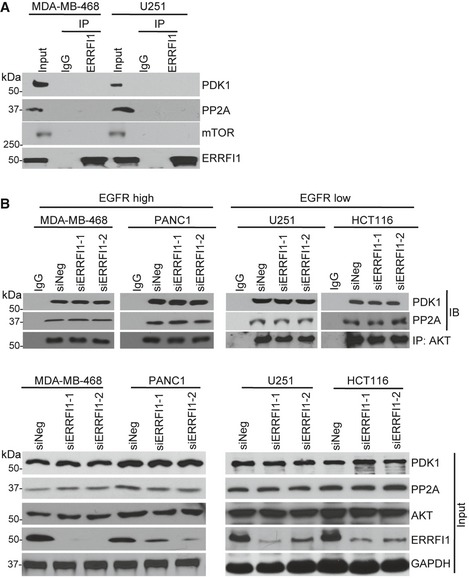
MDA‐MB‐468 and U251 cell lysates were subjected to immunoprecipitation with control IgG or anti‐ERRFI1 antibody. The immunoprecipitates were blotted with the indicated antibodies.
MDA‐MB‐468, PANC1, U251, and HCT116 cells were transfected with siERRFI1. Cell lysates were subjected to immunoprecipitation with control IgG or anti‐AKT antibody. The immunoprecipitates were blotted with the indicated antibodies.
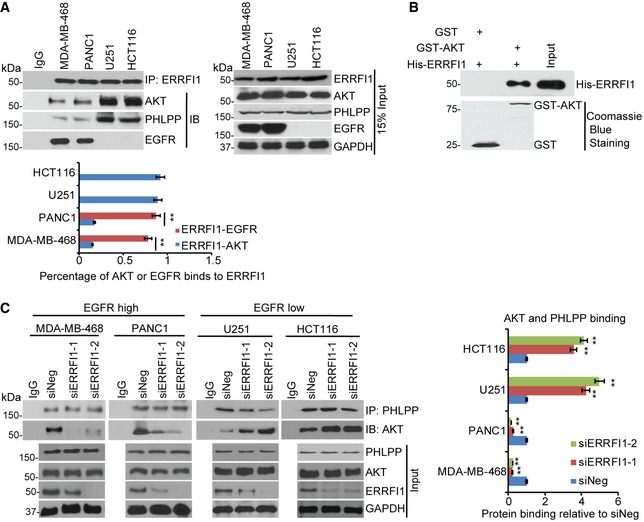
MDA‐MB‐468, PANC1, U251, and HCT116 cell lysates were subjected to immunoprecipitation with control IgG or anti‐ERRFI1 antibody. The immunoprecipitates were then blotted with the indicated antibodies. Quantifications of the Western blots were analyzed by ImageJ. To quantify each interaction, the amount of AKT or EGFR was first normalized back to the input level for each protein and then corrected by the amount of IPed protein, ERRFI1. Error bars represent ± SEM of three independent experiments. The significant difference between ERRFI1‐EGFR binding and ERRFI1‐AKT binding is indicated by: **P < 0.01. Statistical analyses were performed with Student's t‐test.
Purified recombinant GST, GST‐AKT, and His‐ERRFI1 were incubated in cell‐free conditions. The interaction between AKT and ERRFI1 was then examined.
MDA‐MB‐468, PANC1, U251, and HCT116 cell lysates were subjected to immunoprecipitation with control IgG or anti‐PHLPP antibody. The immunoprecipitates were blotted with the indicated antibodies. The interaction was then quantified in each cell line. The amount of AKT corrected by IPed PHLPP was calculated in each of the four cancer cells transfected with siNeg or siERRFI1s. The results were then corrected by the siNeg. The interaction in siNeg is set to 1 within each cell line. Error bars represent ± SEM of three independent experiments. The significant difference between siNeg and siERRFI1 is indicated by: **P < 0.01. Statistical analyses were performed with Student's t‐test.
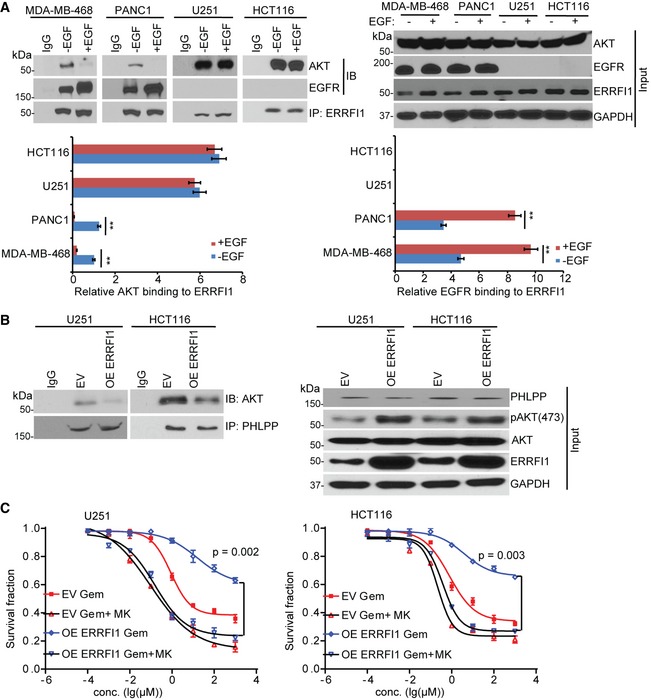
MDA‐MB‐468, PANC1, U251, and HCT116 cells were serum‐starved for 36 h and then treated with EGF (100 ng/ml) for 30 min prior to cell lysis. Cells lysates were subjected to immunoprecipitation with control IgG or anti‐ERRFI1 antibody. The immunoprecipitates were blotted with the indicated antibodies. The ERRFI1‐AKT and ERRFI1‐EGFR interaction was quantified using ImageJ. The immunoprecipitated ERRFI1 levels were normalized for each interaction and then corrected for MDA‐MB‐468 no EGF treatment. The interaction in no EGF‐treated (‐EGF) MDA‐MB‐468 is set to 1. Error bars represent ± SEM of three independent experiments. The significant difference between vehicle and EGF treatment is indicated by: **P < 0.01. Statistical analyses were performed with Student's t‐test.
U251 and HCT116 cells were transfected with ERRFI1 construct. After 48 h, cells were lysed and subjected to immunoprecipitation with control IgG or anti‐PHLPP antibody. The immunoprecipitates were then blotted with the indicated antibodies.
U251 and HCT116 cells from (B) were treated with increasing dose of gemcitabine (Gem) alone or in combination with 10 μM MK‐2206 2HCl (MK) for 72 h. Cell survival was then determined. Each point shows the mean values for three independent experiments; error bars represent ± SEM.
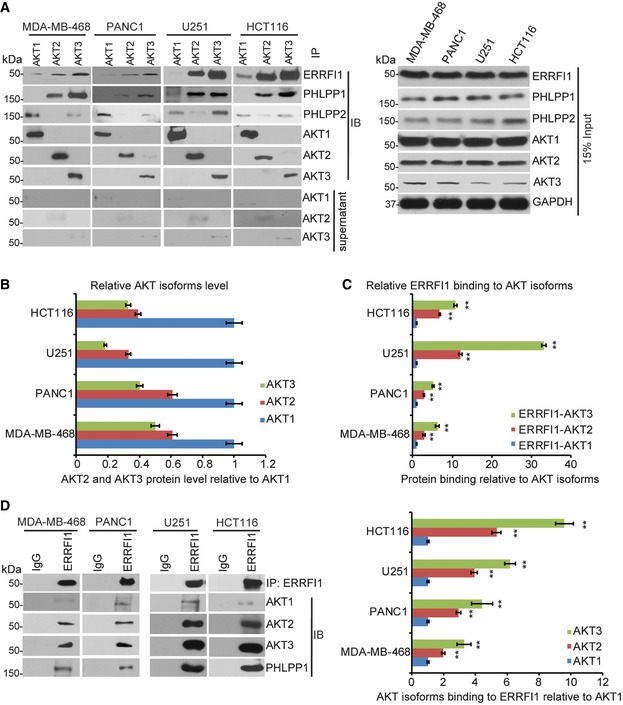
MDA‐MB‐468, PANC1, U251, and HCT116 cells lysates were subjected to immunoprecipitation with control IgG, anti‐AKT1, anti‐AKT2, or anti‐AKT3 antibody. The immunoprecipitates were blotted with the indicated antibodies. The supernatant of the precipitation were blotted with AKT1, AKT2, and AKT3 antibodies to ensure that the majority of the AKT isoform was precipitated with specific antibody.
Quantification analysis of all three AKT isoforms. In the input sample, each AKT isoform was normalized to GAPDH, and then the normalized levels of AKT2 and AKT3 relative to AKT1 were determined within each cell line. Error bars represent ± SEM of three independent experiments.
Quantifications of the interaction between ERRFI1 and three AKT isoforms using ImageJ. Antibodies against three AKT isoforms was used to pull down ERRFI1. The ERRFI1‐AKT isoform interactions were determined in a similar fashion as Fig 3C. Error bars represent ± SEM of three independent experiments. The significant difference between AKT2/or AKT3‐ERRFI1 and AKT1‐ERRFI1 interaction is indicated by: **P < 0.01. Statistical analyses were performed with Student's t‐test.
Cells lysates from (A) were subjected to immunoprecipitation with control IgG or anti‐ERRFI1 antibody. The immunoprecipitates were blotted with the indicated antibodies. The interactions were quantified in a similar fashion as in (C). Error bars represent ± SEM of three independent experiments. The significant difference between AKT2/or AKT3‐ERRFI1 and AKT1‐ERRFI1 interaction is indicated by: **P < 0.01. Statistical analyses were performed with Student's t‐test.
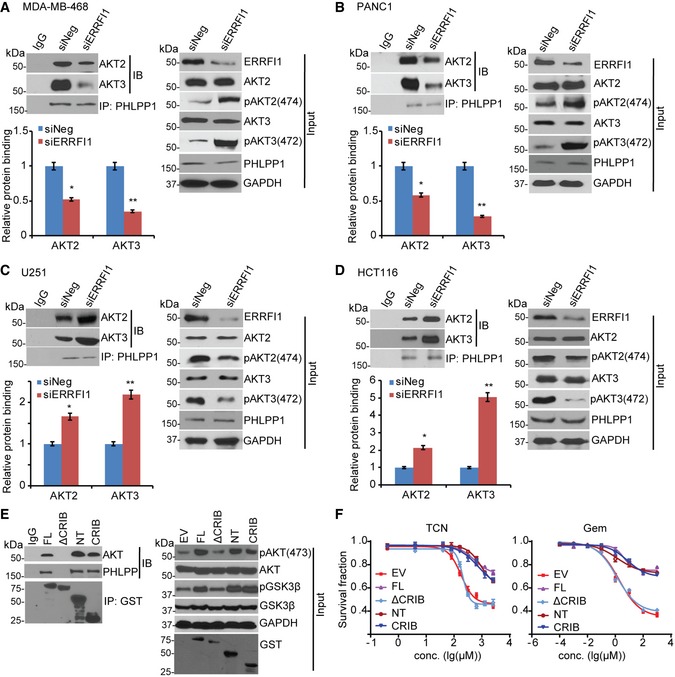
- A–D
MDA‐MB‐468 (A), PANC1 (B), U251 (C), and HCT116 (D) were transfected with siNeg or siERRFI1. Cell lysates were subjected to immunoprecipitation with control IgG or anti‐PHLPP1 antibody. The immunoprecipitates were blotted with the indicated antibodies. AKT‐PHLPP interaction was quantified as described before. Error bars represent ± SEM of three independent experiments. The significant difference between siNeg and siERRFI1 is indicated by: *P < 0.05, **P < 0.01. Statistical analyses were performed with Student's t‐test.
- E
U251 cells were transfected with GST‐tagged full‐length ERRFI1 (FL) or ERRFI1 truncation constructs; 48 h later, half of the cells were harvested and lysates were subjected to immunoprecipitation with control IgG or anti‐GST antibody. The immunoprecipitates were then blotted with the indicated antibodies.
- F
The rest of the U251 cells from (E) were treated with increasing doses of TCN or gemcitabine for 3 days. Survival fraction was determined by CYQUANT assay. The x‐axis indicates drug dose, and the y‐axis indicates the survival fraction after drug exposure. Overexpression efficiency is shown in (E, input). Error bars represent ± SEM of three independent experiments.
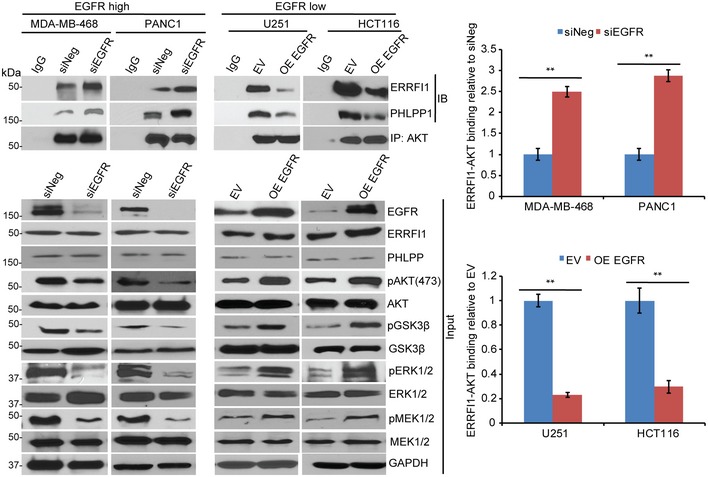
MDA‐MB‐468 and PANC1 cells were transfected with siEGFR, and U251 and HCT116 cells were transfected with empty vector (EV) or EGFR construct; 48 h later, cell lysates were subjected to immunoprecipitation with control IgG, or anti‐AKT antibody. The immunoprecipitates were blotted with the indicated antibodies. Quantification of the binding was calculated. The interaction in cells transfected with siNeg or EV was set to 1 within each cell line. Error bars represent ± SEM of three independent experiments. The significant difference between siNeg and siEGFR, or EV and OE EGFR is indicated by: **P < 0.01. Statistical analyses were performed with Student's t‐test.
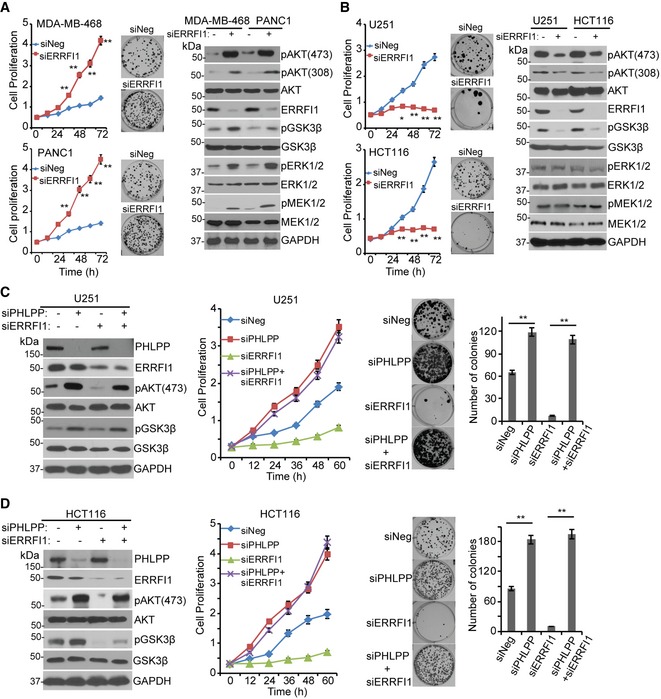
- A, B
Knockdown of ERRFI1 increased proliferation and colony formation in MDA‐MB‐468 and PANC1, two EGFR‐high cells (A). Knockdown of ERRFI1 decreased proliferation and colony formation in U251 and HCT116 EGFR‐low cells (B). Cell proliferation was monitored every 12 h. The x‐axis indicates time post‐treatment, and the y‐axis indicates cell proliferation rate. The representative colony formation pictures from triplicate experiments are shown. Error bars represent ± SEM of three independent experiments; *P < 0.05, **P < 0.01 compared to siNeg. Statistical analyses were performed with Student's t‐test. Remaining cells were blotted with the indicated antibodies.
- C, D
U251 and HCT116 cells were transfected with indicated siRNA. Cell lysates were blotted with the indicated antibodies. Cell proliferation and colony formation were assessed. Quantification of colony formation is shown. Error bars represent ± SEM of three independent experiments. **P < 0.01. Statistical analyses were performed with Student's t‐test.
- A
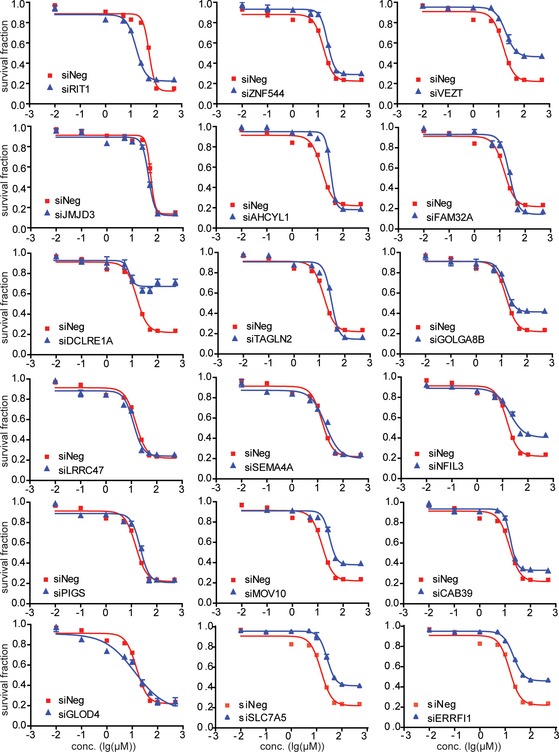
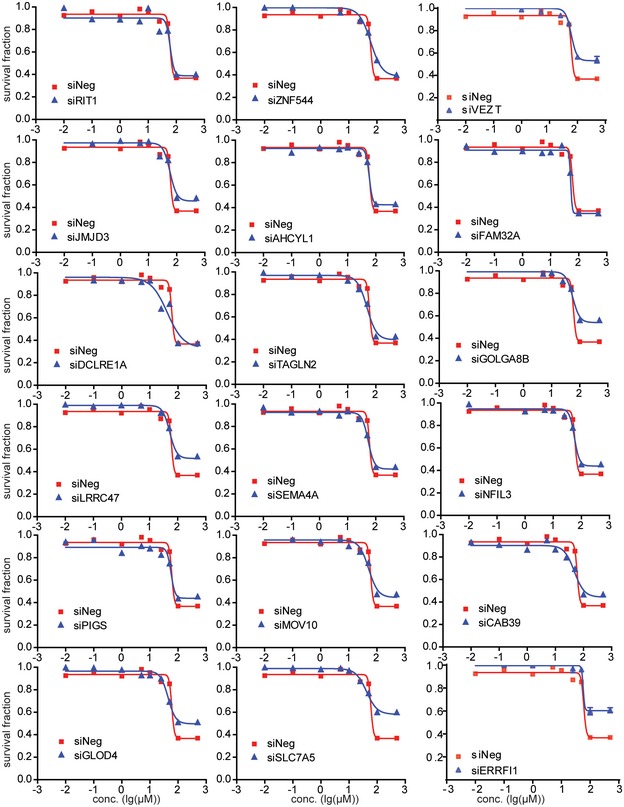
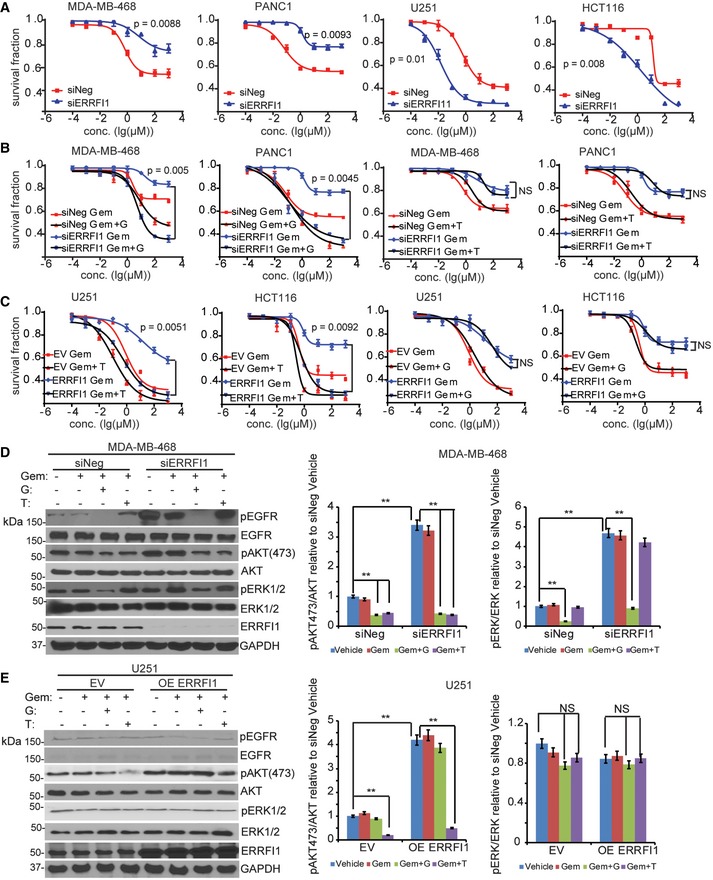
MDA‐MB‐468, PANC1, U251, and HCT116 cells transfected with siERRFI1 were treated with increasing doses of gemcitabine for 72 h, and cell survival was then determined. The x‐axis indicates drug dose, and the y‐axis indicates the survival fraction after gemcitabine exposure. Knockdown efficiency is shown in (D). Error bars represent the SEM of three independent experiments. Statistical analyses were performed with Student's t‐test.
- B
MDA‐MB‐468 and PANC1 cells transfected with siERRFI1 were treated with increasing doses of gemcitabine (Gem) alone or in combination with either 10 μM gefitinib (G) or 10 μM TCN (T) for 72 h. Cell survival was then determined. Knockdown efficiency is shown in (D). Error bars represent the SEM of three independent experiments. Statistical analyses were performed with Student's t‐test.
- C
U251 and HCT116 transfected with ERRFI1 plasmid were treated with Gem alone or in combination with either 10 μM T or 10 μM G for 72 h. Cell survival was then determined. Overexpression efficiency is shown in (E). Error bars represent the SEM of three independent experiments. Statistical analyses were performed with Student's t‐test.
- D, E
MDA‐MB‐468 and U251 cells from (B and C) were treated with vehicle or 20 nM of Gem alone or in combination with either 10 μM of G or 10 μM of T for 12 h. Cells lysates were blotted with the indicated antibodies. The pAKT473/AKT ratio and pERK473/ERK ratio were quantified. The ratio in siNeg or EV is set to 1 within each cell line. Data represent the SEM of three independent experiments. **P < 0.01. Statistical analyses were performed with Student's t‐test.
- A
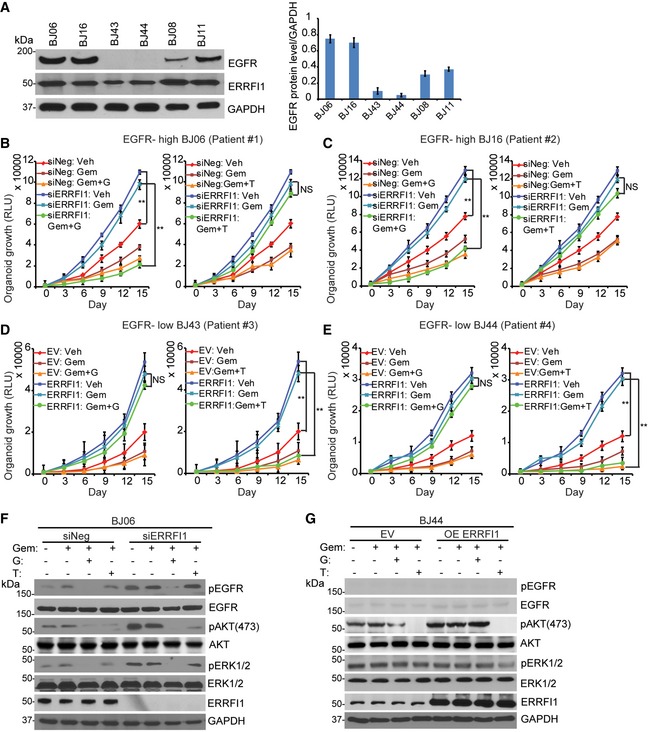
Organoid lysates from six human breast cancer PDX tumors were blotted with EGFR antibody. Quantification of EGFR protein relative to the GAPDH was determined. Error bars represent the SEM of three independent experiments.
- B, C
EGFR‐high BJ06 and BJ16 organoids transfected with siERRFI1 were treated with vehicle (Veh) or 50 nM of gemcitabine (Gem) alone or in combination with either 10 μM gefitinib (G) or 10 μM TCN (T). Organoid growth was monitored every 3 days. Knockdown efficiency is shown in (F). Error bars represent the SEM of three independent experiments. **P < 0.01. Statistical analyses were performed with Student's t‐test.
- D, E
EGFR‐low BJ43 and BJ44 organoids transfected with ERRFI1 plasmid were treated as above. Organoid growth was monitored every 3 days. Overexpression efficiency is shown in (G). Error bars represent the SEM of three independent experiments. **P < 0.01. Statistical analyses were performed with Student's t‐test.
- F, G
BJ06 and BJ44 organoids were treated with vehicle or 50 nM of Gem alone or in combination with either 10 μM of G or 10 μM of T for 72 h. Organoid lysates were blotted with the indicated antibodies.
Similar articles
-
The induction of MIG6 under hypoxic conditions is critical for dormancy in primary cultured lung cancer cells with activating EGFR mutations.Oncogene. 2017 May 18;36(20):2824-2834. doi: 10.1038/onc.2016.431. Epub 2016 Nov 28. Oncogene. 2017. PMID: 27893711
-
Down-regulation of mitogen-inducible gene 6, a negative regulator of EGFR, enhances resistance to MEK inhibition in KRAS mutant cancer cells.Cancer Lett. 2012 Mar;316(1):77-84. doi: 10.1016/j.canlet.2011.10.023. Epub 2011 Oct 23. Cancer Lett. 2012. PMID: 22082529
-
APE1 stimulates EGFR-TKI resistance by activating Akt signaling through a redox-dependent mechanism in lung adenocarcinoma.Cell Death Dis. 2018 Oct 31;9(11):1111. doi: 10.1038/s41419-018-1162-0. Cell Death Dis. 2018. PMID: 30382076 Free PMC article.
-
ErbB3 expression and dimerization with EGFR influence pancreatic cancer cell sensitivity to erlotinib.Cancer Biol Ther. 2007 Apr;6(4):548-54. doi: 10.4161/cbt.6.4.3849. Cancer Biol Ther. 2007. PMID: 17457047
-
Gene 33/Mig6/ERRFI1, an Adapter Protein with Complex Functions in Cell Biology and Human Diseases.Cells. 2021 Jun 22;10(7):1574. doi: 10.3390/cells10071574. Cells. 2021. PMID: 34206547 Free PMC article. Review.
Cited by
-
Vemurafenib inhibits immune escape biomarker BCL2A1 by targeting PI3K/AKT signaling pathway to suppress breast cancer.Front Oncol. 2022 Nov 29;12:906197. doi: 10.3389/fonc.2022.906197. eCollection 2022. Front Oncol. 2022. PMID: 36524001 Free PMC article.
-
Sex-Specific Alterations of the Lung Transcriptome at Birth in Mouse Offspring Prenatally Exposed to Vanilla-Flavored E-Cigarette Aerosols and Enhanced Susceptibility to Asthma.Int J Environ Res Public Health. 2023 Feb 20;20(4):3710. doi: 10.3390/ijerph20043710. Int J Environ Res Public Health. 2023. PMID: 36834405 Free PMC article.
-
Endostar Plus Apatinib Successfully Achieved Long Term Progression-Free Survival in Refractory Ovarian Cancer: A Case Report and Literature Review.Onco Targets Ther. 2021 Dec 1;14:5363-5372. doi: 10.2147/OTT.S335139. eCollection 2021. Onco Targets Ther. 2021. PMID: 34880628 Free PMC article.
-
The Crosstalk Between Signaling Pathways and Cancer Metabolism in Colorectal Cancer.Front Pharmacol. 2021 Nov 23;12:768861. doi: 10.3389/fphar.2021.768861. eCollection 2021. Front Pharmacol. 2021. PMID: 34887764 Free PMC article. Review.
-
RAF1 contributes to cell proliferation and STAT3 activation in colorectal cancer independently of microsatellite and KRAS status.Oncogene. 2023 May;42(20):1649-1660. doi: 10.1038/s41388-023-02683-w. Epub 2023 Apr 5. Oncogene. 2023. PMID: 37020037 Free PMC article.
References
-
- Hanahan D, Weinberg RA (2011) Hallmarks of cancer: the next generation. Cell 144: 646–674 - PubMed
-
- Stephens L, Anderson K, Stokoe D, Erdjument‐Bromage H, Painter GF, Holmes AB, Gaffney PR, Reese CB, McCormick F, Tempst P, et al (1998) Protein kinase B kinases that mediate phosphatidylinositol 3,4,5‐trisphosphate‐dependent activation of protein kinase B. Science 279: 710–714 - PubMed
-
- Alessi DR, Deak M, Casamayor A, Caudwell FB, Morrice N, Norman DG, Gaffney P, Reese CB, MacDougall CN, Harbison D, et al (1997) 3‐Phosphoinositide‐dependent protein kinase‐1 (PDK1): structural and functional homology with the Drosophila DSTPK61 kinase. Curr Biol 7: 776–789 - PubMed
-
- Sarbassov DD, Guertin DA, Ali SM, Sabatini DM (2005) Phosphorylation and regulation of Akt/PKB by the rictor‐mTOR complex. Science 307: 1098–1101 - PubMed
Publication types
MeSH terms
Substances
Grants and funding
LinkOut - more resources
Full Text Sources
Other Literature Sources
Molecular Biology Databases
Research Materials
Miscellaneous
