

Western Diet Triggers NLRP3-Dependent Innate Immune Reprogramming
- PMID: 29328911
- PMCID: PMC6324559
- DOI: 10.1016/j.cell.2017.12.013
Western Diet Triggers NLRP3-Dependent Innate Immune Reprogramming
Abstract
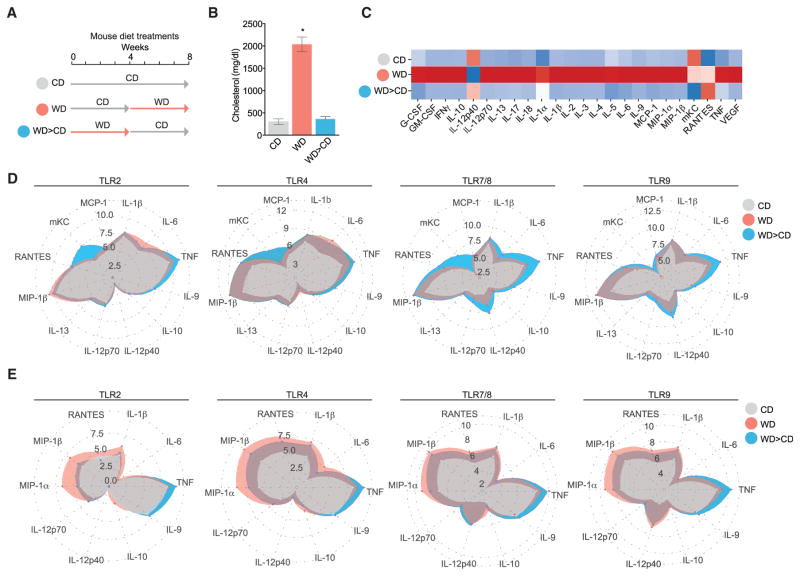
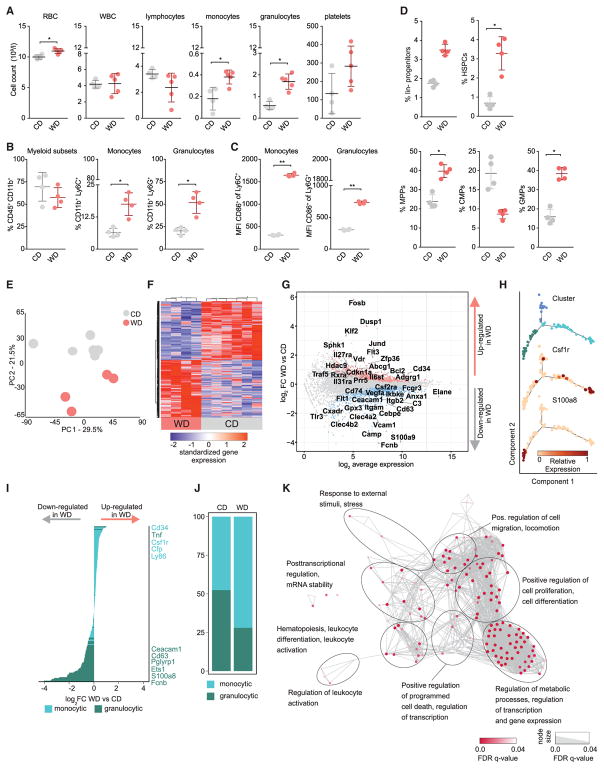
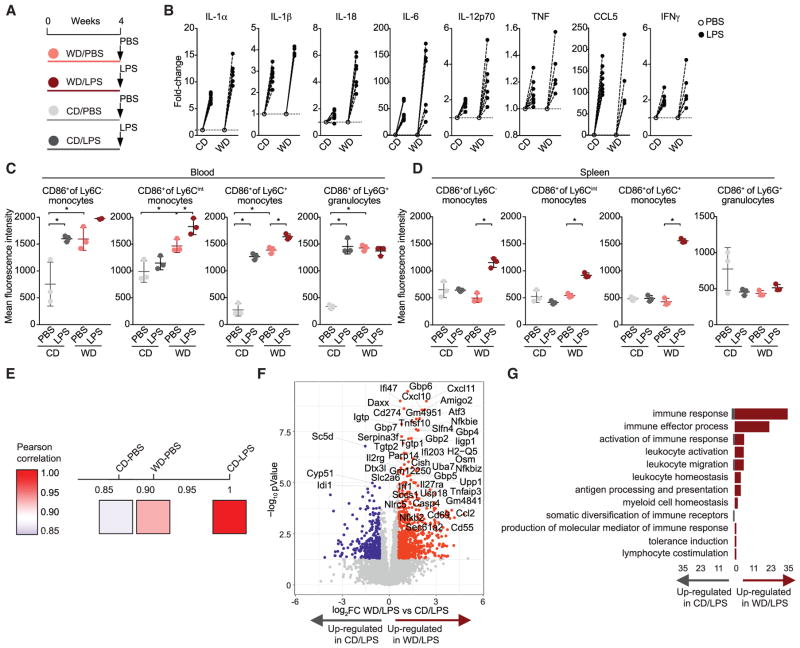
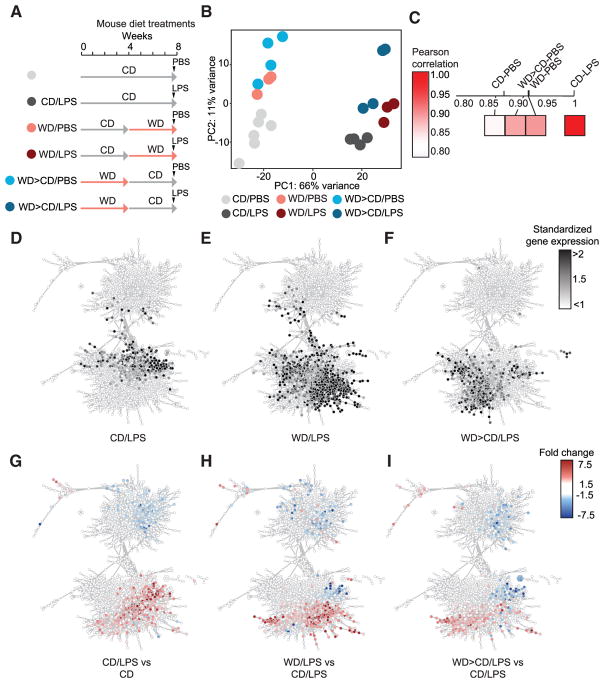
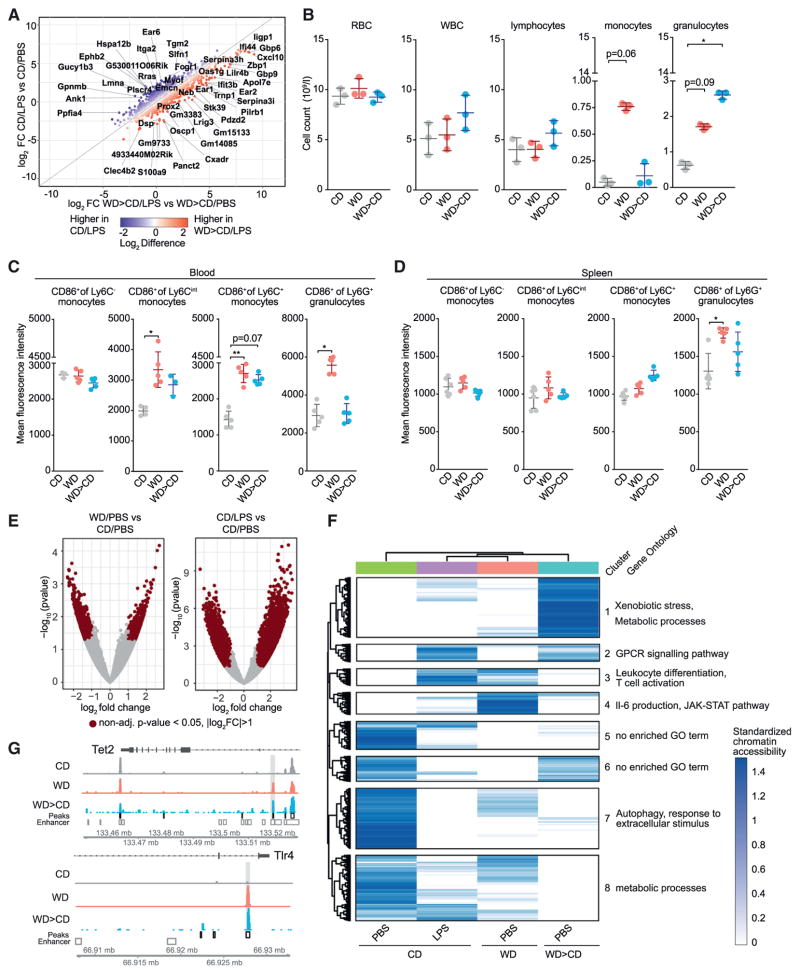
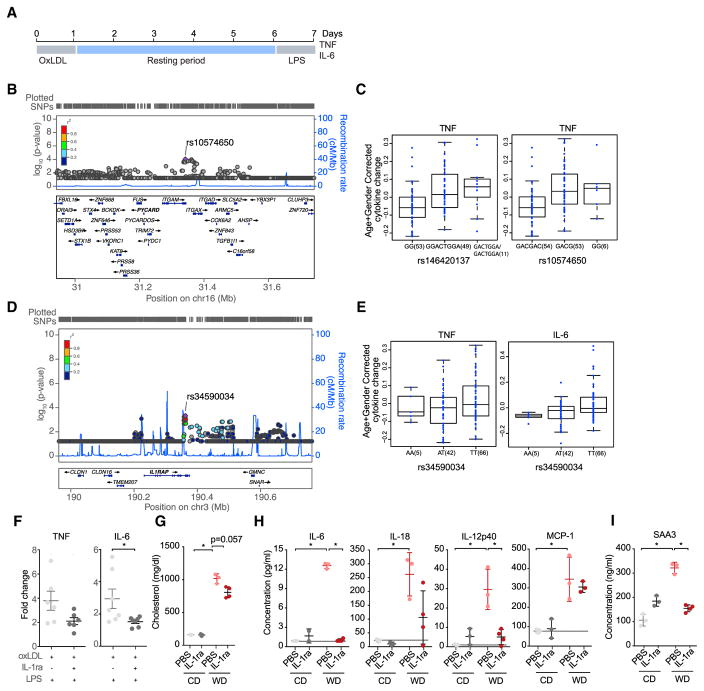
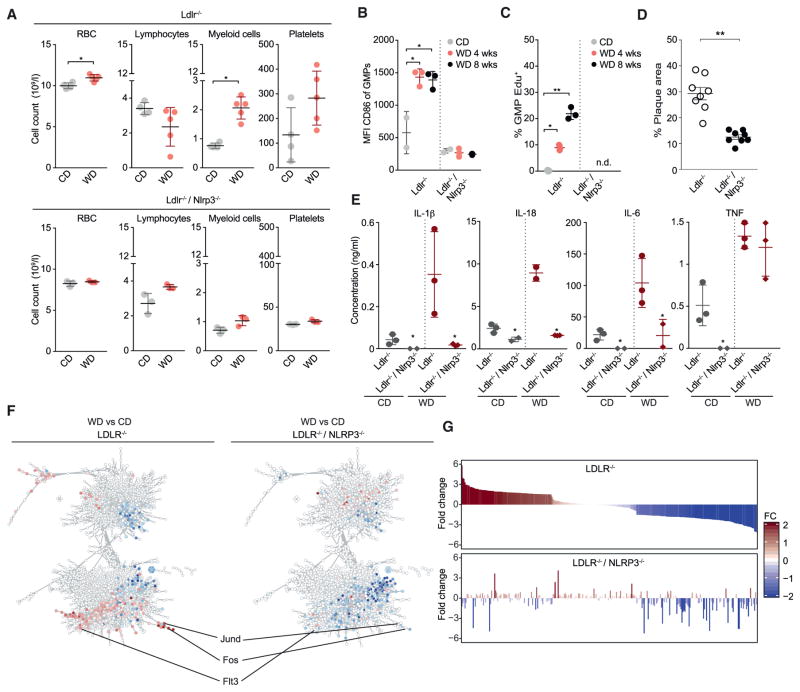
Long-term epigenetic reprogramming of innate immune cells in response to microbes, also termed "trained immunity," causes prolonged altered cellular functionality to protect from secondary infections. Here, we investigated whether sterile triggers of inflammation induce trained immunity and thereby influence innate immune responses. Western diet (WD) feeding of Ldlr-/- mice induced systemic inflammation, which was undetectable in serum soon after mice were shifted back to a chow diet (CD). In contrast, myeloid cell responses toward innate stimuli remained broadly augmented. WD-induced transcriptomic and epigenomic reprogramming of myeloid progenitor cells led to increased proliferation and enhanced innate immune responses. Quantitative trait locus (QTL) analysis in human monocytes trained with oxidized low-density lipoprotein (oxLDL) and stimulated with lipopolysaccharide (LPS) suggested inflammasome-mediated trained immunity. Consistently, Nlrp3-/-/Ldlr-/- mice lacked WD-induced systemic inflammation, myeloid progenitor proliferation, and reprogramming. Hence, NLRP3 mediates trained immunity following WD and could thereby mediate the potentially deleterious effects of trained immunity in inflammatory diseases.
Keywords: ASC; NLRP3 inflammasome; Western diet feeding; atherosclerosis; epigenetic reprogramming; granulocyte macrophage progenitors; innate immune memory; non-communicable diseases; sterile inflammation; trained immunity.
Copyright © 2017 Elsevier Inc. All rights reserved.
Conflict of interest statement
The authors declare no competing interests.
Figures
Comment in
-
Immune Training Unlocks Innate Potential.Cell. 2018 Jan 11;172(1-2):3-5. doi: 10.1016/j.cell.2017.12.034. Cell. 2018. PMID: 29328917
-
Macrophages Remember Cheeseburgers and Promote Inflammation via NLRP3.Trends Mol Med. 2018 Apr;24(4):335-337. doi: 10.1016/j.molmed.2018.02.005. Epub 2018 Feb 23. Trends Mol Med. 2018. PMID: 29483038
-
Food for Training-Western Diet and Inflammatory Memory.Cell Metab. 2018 Mar 6;27(3):481-482. doi: 10.1016/j.cmet.2018.02.012. Cell Metab. 2018. PMID: 29514058
-
Training myeloid precursors with fungi, bacteria and chips.Nat Immunol. 2018 Apr;19(4):320-322. doi: 10.1038/s41590-018-0073-7. Nat Immunol. 2018. PMID: 29563630 No abstract available.
-
Trained immunity and cardiovascular disease: is it time for translation to humans?Cardiovasc Res. 2018 May 1;114(6):e41-e42. doi: 10.1093/cvr/cvy043. Cardiovasc Res. 2018. PMID: 29897493 No abstract available.
Similar articles
-
OxLDL-mediated immunologic memory in endothelial cells.J Mol Cell Cardiol. 2020 Sep;146:121-132. doi: 10.1016/j.yjmcc.2020.07.006. Epub 2020 Jul 26. J Mol Cell Cardiol. 2020. PMID: 32726647
-
Trained Immunity: Long-Term Adaptation in Innate Immune Responses.Arterioscler Thromb Vasc Biol. 2021 Jan;41(1):55-61. doi: 10.1161/ATVBAHA.120.314212. Epub 2020 Oct 22. Arterioscler Thromb Vasc Biol. 2021. PMID: 33086868 Review.
-
Food for Training-Western Diet and Inflammatory Memory.Cell Metab. 2018 Mar 6;27(3):481-482. doi: 10.1016/j.cmet.2018.02.012. Cell Metab. 2018. PMID: 29514058
-
The Intersection of Epigenetics and Metabolism in Trained Immunity.Immunity. 2021 Jan 12;54(1):32-43. doi: 10.1016/j.immuni.2020.10.011. Epub 2020 Nov 20. Immunity. 2021. PMID: 33220235 Review.
-
Long-term activation of the innate immune system in atherosclerosis.Semin Immunol. 2016 Aug;28(4):384-93. doi: 10.1016/j.smim.2016.04.004. Epub 2016 Apr 22. Semin Immunol. 2016. PMID: 27113267 Review.
Cited by
-
Trained immunity and host-pathogen interactions.Cell Microbiol. 2020 Dec;22(12):e13261. doi: 10.1111/cmi.13261. Epub 2020 Sep 17. Cell Microbiol. 2020. PMID: 32902895 Free PMC article. Review.
-
Western lifestyle, metaflammation and the cell of origin of colon cancer.Nat Rev Gastroenterol Hepatol. 2024 Sep;21(9):603-604. doi: 10.1038/s41575-024-00964-7. Nat Rev Gastroenterol Hepatol. 2024. PMID: 39048736 No abstract available.
-
An Assessment of the Glyconutrient Ambrotose™ on Immunity, Gut Health, and Safety in Men and Women: A Placebo-Controlled, Double-Blind, Randomized Clinical Trial.Nutrients. 2020 Jun 11;12(6):1751. doi: 10.3390/nu12061751. Nutrients. 2020. PMID: 32545396 Free PMC article. Clinical Trial.
-
Genetic and epigenetic regulation of inflammasomes: Role in atherosclerosis.Atherosclerosis. 2024 Sep;396:118541. doi: 10.1016/j.atherosclerosis.2024.118541. Epub 2024 Jul 14. Atherosclerosis. 2024. PMID: 39111028 Review.
-
Immune and inflammatory mechanisms of abdominal aortic aneurysm.Front Immunol. 2022 Oct 5;13:989933. doi: 10.3389/fimmu.2022.989933. eCollection 2022. Front Immunol. 2022. PMID: 36275758 Free PMC article. Review.
References
-
- Bekkering S, Quintin J, Joosten LAB, van der Meer JW, Netea MG, Riksen NP. Oxidized low-density lipoprotein induces long-term proinflammatory cytokine production and foam cell formation via epigenetic reprogramming of monocytes. Arterioscler Thromb Vasc Biol. 2014;34:1731–1738. - PubMed
-
- Bekkering S, Arts RJW, Novakovic B, Kourtzelis I, van der Heijden CDCC, Li Y, Popa CD, ter Horst R, van Tuijl J, Netea-Maier RT, et al. Metabolic Induction of Trained Immunity through the Mevalonate Pathway. Cell. 2018:172. doi: 10.1016/j.cell.2017.11.025. Published online January 11, 2018. - DOI - PubMed
-
- Boettcher S, Manz MG. Regulation of inflammation- and infection-driven hematopoiesis. Trends Immunol. 2017;38:345–357. - PubMed
-
- Brasacchio D, Okabe J, Tikellis C, Balcerczyk A, George P, Baker EK, Calkin AC, Brownlee M, Cooper ME, El-Osta A. Hyperglycemia induces a dynamic cooperativity of histone methylase and demethylase enzymes associated with gene-activating epigenetic marks that coexist on the lysine tail. Diabetes. 2009;58:1229–1236. - PMC - PubMed
-
- Cao X. Self-regulation and cross-regulation of pattern-recognition receptor signalling in health and disease. Nat Rev Immunol. 2016;16:35–50. - PubMed
Publication types
MeSH terms
Substances
Grants and funding
LinkOut - more resources
Full Text Sources
Other Literature Sources
Molecular Biology Databases
Miscellaneous
