Review
. 2018 Feb;40(1):11-29.
doi: 10.1007/s11357-018-0005-3. Epub 2018 Jan 11.

Analysis of DNA modifications in aging research

Affiliations
Review

Analysis of DNA modifications in aging research

Dustin R Masser et al. Geroscience. 2018 Feb.

Abstract

As geroscience research extends into the role of epigenetics in aging and age-related disease, researchers are being confronted with unfamiliar molecular techniques and data analysis methods that can be difficult to integrate into their work. In this review, we focus on the analysis of DNA modifications, namely cytosine methylation and hydroxymethylation, through next-generation sequencing methods. While older techniques for modification analysis performed relative quantitation across regions of the genome or examined average genome levels, these analyses lack the desired specificity, rigor, and genomic coverage to firmly establish the nature of genomic methylation patterns and their response to aging. With recent methodological advances, such as whole genome bisulfite sequencing (WGBS), bisulfite oligonucleotide capture sequencing (BOCS), and bisulfite amplicon sequencing (BSAS), cytosine modifications can now be readily analyzed with base-specific, absolute quantitation at both cytosine-guanine dinucleotide (CG) and non-CG sites throughout the genome or within specific regions of interest by next-generation sequencing. Additional advances, such as oxidative bisulfite conversion to differentiate methylation from hydroxymethylation and analysis of limited input/single-cells, have great promise for continuing to expand epigenomic capabilities. This review provides a background on DNA modifications, the current state-of-the-art for sequencing methods, bioinformatics tools for converting these large data sets into biological insights, and perspectives on future directions for the field.

Keywords: DNA methylation; Epigenetics; Methods.


Figures
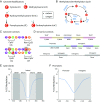
Fig. 1
Fig. 1
Fundamental principles of DNA modifications. a Cytosine bases exist in an unmodified form and with methyl, hydroxymethyl, formyl, and carboxy additions at the five positions of the pyrimidine ring. b Over the last decade, advances in the understanding of modification regulation have characterized the cycle of modification addition and oxidation. DNA methyltransferases (DNMTs) add methyl groups in which Tet methylcytosine dioxygenases (TETs) sequentially oxidize modifications back to an unmodified cytosine or include base excision repair (BER) through thymine DNA glycosylase (TDG). c Cytosines are present in palindromic CG contexts with methylation paralleled between the two strands while CH (where H is A, C, or T) modifications are by nature strand specific. d Changes in DNA modifications can occur across different forms of genomic elements with differing functional outcomes. CpG islands are areas of high CG density that are flanked by shore and shelf regions upstream and downstream. Similarly, methylation of promoter regions has traditionally been a focus but intragenic regions, either in exons or introns are an area of growing interest and play a role in gene expression regulation. e CG methylation is typically low over CG islands but higher in shores and shelves. f CG methylation across promoters often varies greatly across a relatively narrow region with lowest methylation typically observed around the transcription start site (TSS), even in un-expressed genes
Fig. 2
Fig. 2
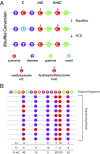
Bisulfite conversion and quantitation of mC. a Bisulfite sequencing approaches are based on the concept that methylation, or hydroxymethylation, prevents the deamidation of cytosine to uracil by bisulfite. With PCR amplification, uracils are copied as thymines. The difference in methylation, or hydroxymethylation, status of a cytosine can then be read through sequencing as a base difference (C vs T). b Quantitation of methylation level is achieved by sequencing over a genomic region many times. The number of times a cytosine in the reference sequence is read as a thymine or cytosine is counted. The methylation level is then computed for each cytosine as C/C + T for that site. The greater the number of times that site is sequenced, the more accurate the methylation quantitation
Fig. 3
Fig. 3
Methods for base-specific cytosine modification quantitation. a Whole-genome bisulfite sequencing (WGBS) in general principle consists of bisulfite modification of genomic DNA and then creation of a sequencing library. Variants may switch the order of bisulfite conversion and library preparation. This approach gives quantitation across the genome but requires very large amounts of sequencing. b A long-standing approach to the analysis of large portions of the genome, but without the expense of WGBS is reduced representation bisulfite sequencing (RRBS). Genomic DNA is digested at CG sites, and then, the resulting smaller molecular weight fragments are isolated. These fragments are made into a sequencing library and bisulfite converted prior to sequencing. This approach focuses the data on CG rich regions of the genome. c Bisulfite oligonucleotide capture sequencing (BOCS) is analogous to exome sequencing techniques. In this approach, a whole genome library is made and then bisulfite converted. Genomic regions of interest are then captured with oligonucleotide probes greatly enriching for regions of interest and thereby decreasing the amount of sequencing required. d Often, analysis of a specific genomic loci is desired, e.g., a gene of interest. With bisulfite amplicon sequencing (BSAS), the specific regions are amplified from bisulfite converted DNA and then made into a sequencing library. In effect, the PCR amplification greatly enriches for the region of interest. e While not a sequencing approach, one of the most common approaches to methylation quantitation is with a microarray format. This is a modification of SNP microarrays where probes are designed to detect a converted (T) or unconverted (C) at a CG site. Genomic DNA is bisulfite converted and amplified prior to hybridization to a microarray were the two different “alleles” have different reported colors. This is a high throughput approach, but a microarray must be available for the CG sites of interest and the species being examined. Currently, only human microarrays are commercially available
Fig. 4
Fig. 4
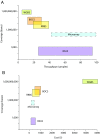
Sample throughput and cost as a function of genomic coverage. Experimental design for DNA modification analysis requires consideration of a range of scientific and practical factors. a Genomic coverage as a function of sample throughput. With greater coverage of the genome, as a general principle, sample throughput decreases. b Cost per sample increases as a function of genomic coverage. Costs vary on the number of samples performed and the specific circumstances of a study, but generally, the more genome analyzed the greater the cost as more sequencing is performed. Note: costs are estimated at a 15× sequencing depth and the microarray technology is denoted with dashed lines as the calculations of genomic coverage are inherently different as this is not a sequencing approach
Fig. 5
Fig. 5
Base-specific versus region-based quantitation. For computational simplicity, methylation analysis is sometimes performed as regions. This signal compression comes with distinct disadvantages. a In this example from Mangold et al. (2017a), a region ± 500 bp of the mouse H2-K1 promoter containing a number of genomic features (promoter, intron, exon, and transcription factor sites) and CG (purple tics) and CH sites (black, tics) was examined by BSAS. CG (b) and CH (c) methylation demonstrated distinct, base-specific, profiles across the region examined. Differences in methylation levels between the cerebral cortex and cerebellum were found at a number of sites (*p < 0.05, t test, B-H MTC, n = 8/group). If these values are compressed into a region analysis across the 1 kb, differences are still evident in CG (d) and CH (e) methylation but the magnitude of differences are compressed and the specificity for the differentially methylated sites to genomic features is lost
Fig. 6
Fig. 6
Hydroxymethylation analysis. Most DNA modification analysis studies use bisulfite sequencing approaches that do not differentiate between methylation and hydroxymethylation. However, hydroxymethylation is abundant in a number of tissues. For example, using data from Hadad et al. (2016) who examined the mouse hippocampus by oxidative bisulfite sequencing that differentiates between methylation and hydroxymethylation, it is clear (a) that one fourth of what would normally be called as methylation is in fact hydroxymethylation. Further demonstrating this point, within a relatively small region (~ 120 bp of Fkbp6; b), the levels of methylation and hydroxymethylation are clearly regulated in a base-specific fashion. Hydroxymethylation can be differentiated from methylation by an oxidation step (c) that de-protects hydroxymethylation and allows a specific methylation quantitation. When combined with bisulfite sequencing, a subtractive approach can be used to quantify methylation and hydroxymethylation individually

Similar articles

Cited by

References

    1. Adey A, Shendure J. Ultra-low-input, tagmentation-based whole-genome bisulfite sequencing. Genome Res. 2012;22:1139–1143. doi: 10.1101/gr.136242.111. - DOI - PMC - PubMed
    1. Akalin A, et al. methylKit: a comprehensive R package for the analysis of genome-wide DNA methylation profiles. Genome Biol. 2012;13:R87. doi: 10.1186/gb-2012-13-10-r87. - DOI - PMC - PubMed
    1. Akalin A, et al. Base-pair resolution DNA methylation sequencing reveals profoundly divergent epigenetic landscapes in acute myeloid leukemia. PLoS Genet. 2012;8:e1002781. doi: 10.1371/journal.pgen.1002781. - DOI - PMC - PubMed
    1. Allis CD, Jenuwein T. The molecular hallmarks of epigenetic control. Nat Rev Genet. 2016;17:487–500. doi: 10.1038/nrg.2016.59. - DOI - PubMed
    1. Allum F, et al. Characterization of functional methylomes by next-generation capture sequencing identifies novel disease-associated variants. Nat Commun. 2015;6:7211. doi: 10.1038/ncomms8211. - DOI - PMC - PubMed

Publication types