. 2018 Feb 14;38(7):1622-1633.
doi: 10.1523/JNEUROSCI.2415-17.2017. Epub 2018 Jan 11.

Diversity and Connectivity of Layer 5 Somatostatin-Expressing Interneurons in the Mouse Barrel Cortex

Affiliations

Diversity and Connectivity of Layer 5 Somatostatin-Expressing Interneurons in the Mouse Barrel Cortex

Maximiliano José Nigro et al. J Neurosci. .

Abstract

Inhibitory interneurons represent 10-15% of the neurons in the somatosensory cortex, and their activity powerfully shapes sensory processing. Three major groups of GABAergic interneurons have been defined according to developmental, molecular, morphological, electrophysiological, and synaptic features. Dendritic-targeting somatostatin-expressing interneurons (SST-INs) have been shown to display diverse morphological, electrophysiological, and molecular properties and activity patterns in vivo However, the correlation between these properties and SST-IN subtype is unclear. In this study, we aimed to correlate the morphological diversity of layer 5 (L5) SST-INs with their electrophysiological and molecular diversity in mice of either sex. Our morphological analysis demonstrated the existence of three subtypes of L5 SST-INs with distinct electrophysiological properties: T-shaped Martinotti cells innervate L1, and are low-threshold spiking; fanning-out Martinotti cells innervate L2/3 and the lower half of L1, and show adapting firing patterns; non-Martinotti cells innervate L4, and show a quasi-fast spiking firing pattern. We estimated the proportion of each subtype in L5 and found that T-shaped Martinotti, fanning-out Martinotti, and Non-Martinotti cells represent ∼10, ∼50, and ∼40% of L5 SST-INs, respectively. Last, we examined the connectivity between the three SST-IN subtypes and L5 pyramidal cells (PCs). We found that L5 T-shaped Martinotti cells inhibit the L1 apical tuft of nearby PCs; L5 fanning-out Martinotti cells also inhibit nearby PCs but they target the dendrite mainly in L2/3. On the other hand, non-Martinotti cells inhibit the dendrites of L4 neurons while avoiding L5 PCs. Our data suggest that morphologically distinct SST-INs gate different excitatory inputs in the barrel cortex.SIGNIFICANCE STATEMENT Morphologically diverse layer 5 SST-INs show different patterns of activity in behaving animals. However, little is known about the abundance and connectivity of each morphological type and the correlation between morphological subtype and spiking properties. We demonstrate a correlation between the morphological and electrophysiological diversity of layer 5 SST-INs. Based on these findings we built a classifier to infer the abundance of each morphological subtype. Last, using paired recordings combined with morphological analysis, we investigated the connectivity of each morphological subtype. Our data suggest that, by targeting different cell types and cellular compartments, morphologically diverse SST-INs might gate different excitatory inputs in the mouse barrel cortex.

Keywords: barrel cortex; cortical circuits; inhibition; interneurons; somatostatin.


Figures

Figure 1.
Figure 1.
AC, Confocal stacks showing the distribution of td-Tomato-expressing cells in the SST-cre line (A), the SST/CR intersectional line (B) and the SST/Calb intersectional line (C). In B and C, SST immunoreactivity (IR) is also shown. D, Expression of td-Tomato and CR IR in the SST/CR intersectional line. The area in the dashed box is enlarged in D1. E, Expression of td-Tomato and CR IR in the SST/Calb intersectional line. The area in the dashed box is enlarged in E1. F, Left, The percentage of SST-immunopositive cells expressing td-Tomato in the SST/CR intersectional line across layers. Right, The percentage of td-Tomato cells that express CR in the SST/CR intersectional line across layers. G, Left, The percentage of SST-immunopositive cells expressing td-Tomato in the SST/Calb intersectional line across layers. Right, The percentage of td-Tomato cells that express Calb in the SST/Calb intersectional line across layers.
Figure 2.
Figure 2.
A, Confocal stack showing triple immunostaining for CR, Calb, and YFP in the SST-cre/YFP mouse. BD, Enlarged view of the area delineated by the dashed box in A, representing L5. White arrows indicate double-labeled cells. Red arrows indicate triple-labeled cells. B, Merged image of CR and YFP IR. C, Merged image of Calb and YFP IR. D, Merged image of CR, Calb, and YFP IR. E, Percentage of cells expressing CR, Calb, and YFP in the YFP IR population. F, Percentage of CR, Calb, and YFP-expressing cells in the YFP-CR IR population. G, Percentage of cells expressing CR, Calb, and YFP in the YFP-Calb IR population.
Figure 3.
Figure 3.
AC, Reconstruction of a representative non-Martinotti cell (A), fanning-out Martinotti cell (B), and a T-shaped Martinotti cell (C). Each reconstruction is accompanied on the right by the distribution of nodes relative to the total amount of nodes of the ascending axon in L1–L4, and by the firing pattern of each illustrated cell. Shown are traces during a hyperpolarizing and a suprathreshold depolarizing step. D, Plot of the relative axonal length of the ascending axon in L1 versus L4 of the 30 reconstructed cells. E, Plot of the relative amount of nodes of the ascending axon in L1 versus L4 of the 30 reconstructed cells. F, 3-D plot of the first three principal components of the principal component analysis using 16 morphological parameters of the axon of the 30 reconstructed cells (see Materials and Methods).
Figure 4.
Figure 4.
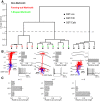
A, Dendrogram obtained from a hierarchical cluster analysis of 17 reconstructed SST cells. The dashed line represents the level at which the clusters were created according to the Thorndike method. Numbers on the x-axis represent the cells' ID color-coded according to the morphological group they were assigned to. B, Reconstructions of representative SST cells belonging to each morphological group. Each reconstruction is accompanied on the right by the distribution of relative axonal length of the ascending axon and the firing pattern for that cell. C, Plots showing the average distribution of the relative axonal length of the ascending axon for each morphological group.
Figure 5.
Figure 5.
A, Representative voltage responses to hyperpolarizing and depolarizing current injections of fanning-out Martinotti, T-shaped Martinotti, and non-Martinotti cells. Injected current steps are shown below the voltage responses. B, Representative voltage responses at rheobase current injections of fanning-out Martinotti, T-shaped Martinotti, and non-Martinotti cells. The injected current step is shown below the voltage response. Insets show AHP waveforms and report the respective duration (see Materials and Methods). C, Morphological reconstructions of the cells illustrated in A and B. Pie charts show the number of cells with a specific firing pattern in each morphological group (red, fanning out Martinotti; green, T-shaped; black, non-Martinotti).
Figure 6.
Figure 6.
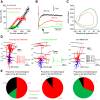
A, Graph showing the f–I curves of 29 morphologically identified SST-INs. B, Representative examples of the AHPs of a fanning-out Martinotti (red), a T-shaped Martinotti (green), and a non-Martinotti (black). The black arrow points to the mAHP. Dashed lines indicate the time point used to determine AHPduration. C, Graph showing the phase-plot of the cells illustrated in B. D, Three examples of correctly classified cells that were morphologically preserved and visually identified as fanning-out Martinotti (left), T-shaped Martinotti (middle), and non-Martinotti (right) cells. E, Pie charts showing the number of cells classified as fanning-out Martinotti, T-shaped Martinotti, or non-Martinotti cells in the three mouse lines used in the present study: SST-cre (left), SST/CR Flp/Cre (middle), and SST/Calb Flp/Cre (right).
Figure 7.
Figure 7.
A, Morphological reconstruction of a connected pair between a fanning-out Martinotti cell (blue, dendrites; red, axon) and a L5 pyramidal neuron (green). Black filled circles represent putative synaptic contacts. Inset, The firing pattern of the fanning-out Martinotti cell. B, IPSCs recorded on the pyramidal cell following stimulation the fanning-out Martinotti cell with a train of action potentials at 20 Hz. Inset, The first IPSC at higher resolution. C, Morphological reconstruction of a connected pair between a T-shaped Martinotti cell (blue, dendrites; red, axon) and a L5 pyramidal cell (green). Black filled circles represent putative synaptic contacts. Inset, The firing pattern of the T-shaped Martinotti cell. D, IPSCs recorded from the pyramidal cell following stimulation of the T-shaped Martinotti cell with a train of action potentials at 20 Hz. Inset, The first IPSC at higher resolution. E, Bar graph showing the connection probability for both types of Martinotti cell and L5 pyramidal neurons. F, Histogram showing the distribution of the synaptic contacts of fanning-out Martinotti cells on the apical dendrites of L5 pyramidal cells. G, Histogram showing the distribution of the synaptic contacts of T-shaped Martinotti cells on the apical dendrite of L5 pyramidal cells.
Figure 8.
Figure 8.
A, Morphological reconstruction of a non-connected pair between a non-Martinotti cell (blue, dendrites; red, axon) and a L5 pyramidal cell (green). Inset, The firing pattern of the non-Martinotti cell. B, A train of action potentials at 20 Hz in the L5 non-Martinotti cell did not evoke IPSCs on the L5 pyramidal neuron. C, Morphological reconstruction of a triple recording between a non-Martinotti cell (blue, dendrites; red, axon) a L5 pyramidal cell (green) and a L4 spiny stellate cell (black). Yellow filled circles represent putative synaptic contacts. Inset, The firing pattern of the non-Martinotti cell. D, A train of action potentials at 20 Hz on the non-Martinotti cell did not evoke IPSCs on the L5 pyramidal neurons, but reliably evoked IPSCs on the L4 neuron. E, Graph reporting the connection probability of paired recordings between L5 non-Martinotti cells and L5 pyramidal cells or L4 stellate cells. F, Graph reporting the synaptic charge of L4/5 paired recordings between a L5 non-Martinotti cell and a L4 stellate cell recorded in voltage-clamp. G, Distribution of synaptic contacts on the dendrites of L4 spiny stellate cells as a function of distance from the soma of the stellate cells.

Similar articles

Cited by

References

    1. Adesnik H, Bruns W, Taniguchi H, Huang ZJ, Scanziani M (2012) A neural circuit for spatial summation in visual cortex. Nature 490:226–231. 10.1038/nature11526 - DOI - PMC - PubMed
    1. Blasdel GG, Lund JS (1983) Termination of afferent axons in macaque striate cortex. J Neurosci 3:1389–1413. - PMC - PubMed
    1. Bortone DS, Olsen SR, Scanziani M (2014) Translaminar inhibitory cells recruited by layer 6 corticothalamic neurons suppress visual cortex. Neuron 82:474–485. 10.1016/j.neuron.2014.02.021 - DOI - PMC - PubMed
    1. Buchanan KA, Blackman AV, Moreau AW, Elgar D, Costa RP, Lalanne T, Tudor Jones AA, Oyrer J, Sjöström PJ (2012) Target-specific expression of presynaptic NMDA receptors in neocortical microcircuits. Neuron 75:451–466. 10.1016/j.neuron.2012.06.017 - DOI - PMC - PubMed
    1. Cadwell CR, Palasantza A, Jiang X, Berens P, Deng Q, Yilmaz M, Reimer J, Shen S, Bethge M, Tolias KF, Sandberg R, Tolias AS (2016) Electrophysiological, transcriptomic and morphologic profiling of single neurons using patch-seq. Nat Biotechnol 34:199–203. 10.1038/nbt.3445 - DOI - PMC - PubMed

Publication types

MeSH terms

LinkOut - more resources