. 2018 Mar:159:130-145.
doi: 10.1016/j.biomaterials.2017.12.019. Epub 2017 Dec 26.

Caveolin-mediated endocytosis of the Chlamydia M278 outer membrane peptide encapsulated in poly(lactic acid)-Poly(ethylene glycol) nanoparticles by mouse primary dendritic cells enhances specific immune effectors mediated by MHC class II and CD4+ T cells

Affiliations

Caveolin-mediated endocytosis of the Chlamydia M278 outer membrane peptide encapsulated in poly(lactic acid)-Poly(ethylene glycol) nanoparticles by mouse primary dendritic cells enhances specific immune effectors mediated by MHC class II and CD4+ T cells

Saurabh Dixit et al. Biomaterials. 2018 Mar.

Abstract

We previously developed a Chlamydia trachomatis nanovaccine (PPM) by encapsulating a chlamydial M278 peptide within poly(lactic acid)-poly(ethylene glycol) biodegradable nanoparticles that immunopotentiated Chlamydia-specific immune effector responses in mice. Herein, we investigated the mechanistic interactions of PPM with mouse bone marrow-derived dendritic cells (DCs) for its uptake, trafficking, and T cell activation. Our results reveal that PPM triggered enhanced expression of effector cytokines and chemokines, surface activation markers (Cd1d2, Fcgr1), pathogen-sensing receptors (TLR2, Nod1), co-stimulatory (CD40, CD80, CD86) and MHC class I and II molecules. Co-culturing of PPM-primed DCs with T cells from C. muridarum vaccinated mice yielded an increase in Chlamydia-specific immune effector responses including CD3+ lymphoproliferation, CD3+CD4+ IFN-γ-secreting cells along with CD3+CD4+ memory (CD44high and CD62Lhigh) and effector (CD44high and CD62Llow) phenotypes. Intracellular trafficking analyses revealed an intense expression and colocalization of PPM predominantly in endosomes. PPM also upregulated the transcriptional and protein expression of the endocytic mediator, caveolin-1 in DCs. More importantly, the specific inhibition of caveolin-1 led to decreased expression of PPM-induced cytokines and co-stimulatory molecules. Our investigation shows that PPM provided enhancement of uptake, probably by exploiting the caveolin-mediated endocytosis pathway, endosomal processing, and MHC II presentation to immunopotentiate Chlamydia-specific immune effector responses mediated by CD4+ T cells.

Keywords: Caveolin; Chlamydia muridarum; Dendritic cells; Endocytosis; Nanovaccine; PLA-PEG nanoparticles.


Figures

Fig. 1
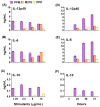
Fig. 1. Differential transcriptional and protein expression of cytokines and chemokines induced by stimulated DCs
For the dose-response studies, DCs were stimulated with various concentrations of PLA-PEG-M278 (PPM), M278 or PLA-PEG-PBS (PPP) and cell-free supernatants were collected after 24 hours to quantify the secretion of IL-12p40 (A), IL-6 (B) and IL-10 (C). For the time-kinetic studies, DCs were stimulated 4–72 hours with 2.5 μg/mL of stimulants to quantify IL-12p40 (D), IL-6 (E) and IL-10 (F). RNA samples were also collected after 24 hours to quantify mRNA gene transcripts of cytokines (G, H) and chemokines (I, J). Data were analyzed by two-way ANOVA followed by Tukey’s post-hoc test using GraphPad Prism 5 software. ***P < 0.001, **P < 0.01 and *P < 0.05.
Fig. 2
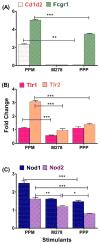
Fig. 2. Enhanced expression of cell surface and pathogen-sensing receptors
DCs were stimulated with PPM, M278 and PPP for 24 hours to quantify the mRNA gene transcripts of Cd1d2 and FcgR1 (A), pathogen-sensing receptors, TLR1, TLR2 (B) and Nod1 and Nod2 (C). Stimulated DCs were also subjected to flow cytometric analysis of CD80 (D), CD86 (E), CD40 (F), MHC-I (G) and MHC-II (H). Analyses were performed by gating on CD11c- APC-Cy7+ cells. The numbers included in D–H histograms are the % of positive cells for the respective molecules. Gene transcripts of co-stimulatory molecules were also quantified 24-hr post-stimulation of DCs (I).
Fig. 3
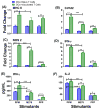
Fig. 3. PPM provides enhancement of Chlamydia-specific T cell immune effector responses
DCs were primed with PPM, M278 or PPP for 24 hours before co-culturing with purified T cells from C. muridarum vaccinated or naïve mice for an additional 48 hours. RNA samples were collected to quantify the mRNA gene transcripts for MHC-II (A), Cd1d2 (B), Nos2 (C) and IFN-γ (D) or cell-free supernatants for quantifying IFN-γ (E) and IL-2 (F). Data were analyzed by two-way ANOVA followed by Tukey’s post-hoc test or the one-tailed unpaired t-test with Welch correction using GraphPad Prism 5 software. ***P < 0.001, **P < 0.01 and *P < 0.05.
Fig. 4
Fig. 4. Chlamydia-specific intracellular cytokine production from CD3+CD4+ IFN-γ secreting T cells
DCs were primed with PPM, M278 or PPP before co-culturing with T cells from naïve and C. muridarum vaccinated mice. For intracellular IFN-γ secretion, cells were stained with CD3-APC-Cy7 and CD4-PerCP-Cy5.5 followed by staining with IFN-γ-APC. Analyses were performed by gating on CD3+ IFN-γ secreting cells for naïve ((A, B, C) and vaccinated co-cultures (D, E, F) and also for CD4+ IFN-γ secreting cells from naïve (G, H, I) and vaccinated (J, K, L) mice.
Fig. 5
Fig. 5. Chlamydia-specific proliferating total T cells, cell proliferation and memory and effector T cells phenotypes
CSFE-labeled T cells from naïve (A, B, C) and vaccinated (D, E, F) mice were co-cultured with primed DCs and analyzed by flow cytometry for CD3+ CFSE+ T cells. Primed DCs were co-cultured with T cells from naïve and vaccinated mice and induction of memory, and effector T cell phenotypes were quantified by staining for CD3, CD4, CD62L, and CD44, respectively. Analyses were performed by gating on CD3+ CD4+ T cells of naïve (G, H, I) and vaccinated (J, K, L) co-cultures.
Fig. 6
Fig. 6. Intracellular trafficking and colocalization of targeted M278 in DCs
DCs were stimulated for 24 hours with PPM, M278 and PPP followed by staining for the subcellular organelles EE (EEA1, early endosome) (A), LE (Rab7, late endosome) (B), ER (endoplasmic reticulum) (C) and lysosome (LAMP-1) (D). Colocalization with organelles was confirmed by probing for the expression of the targeted M278. DAPI (blue) was used to stain the nuclei. The top row (merge) indicate the overlay of images. Direct visualization and imaging were performed employing immunofluorescence microscopy.
Fig. 7
Fig. 7. Expression and colocalization of MHC class I and II molecules
DCs were stimulated with PPM, M278 and PPP followed by staining for MHC class I (A) and II (B) molecules. Subcellular colocalizations with MHC class I and II were confirmed by probing for the expression of the targeted M278. DAPI (blue) was used to stain the nuclei. The top row (merge) indicate the overlay of images. Direct visualization and imaging were performed employing immunofluorescence microscopy.
Fig. 8
Fig. 8. Expression of endocytic mediators and the specific-inhibition of caveolin-1 on immune effector responses
DCs were stimulated with PPM, M278, and PPP for 24 hours to quantify the gene transcripts expression of clathrin (Cltc) and caveolin-1 (Cav1) (A). Stimulated cells were stained for Cav1 expression and intracellular colocalization by probing for the expression of the targeted M278 (B). DAPI (blue) was used to stain the nuclei. The top row (merge) indicate the overlay of images. Direct visualization and imaging were performed employing immunofluorescence microscopy. Specific inhibition of Cav-1 by its inhibitor, filipin caused reduced expression of Cav1 (C) resulting in diminishing the expression of CD40 (D), CD86 (E), IL-6 (F) and IL-12p40 (G). Data analyses and asterisks are as described in Fig. 1.

Similar articles

Cited by

References

    1. Dixit S, Singh SR, Yilma AN, Agee RD, 2nd, Taha M, Dennis VA. Poly(lactic acid)-poly(ethylene glycol) nanoparticles provide sustained delivery of a Chlamydia trachomatis recombinant MOMP peptide and potentiate systemic adaptive immune responses in mice. Nanomedicine. 2014;10:1311–21. - PMC - PubMed
    1. Kalkanidis M, Pietersz GA, Xiang SD, Mottram PL, Crimeen-Irwin B, Ardipradja K, et al. Methods for nano-particle based vaccine formulation and evaluation of their immunogenicity. Methods. 2006;40:20–9. - PubMed
    1. Bachmann MF, Jennings GT. Vaccine delivery: a matter of size, geometry, kinetics and molecular patterns. Nat Rev Immunol. 2010;10:787–96. - PubMed
    1. Jennings GT, Bachmann MF. Designing recombinant vaccines with viral properties: a rational approach to more effective vaccines. Curr Mol Med. 2007;7:143–55. - PubMed
    1. Shi Y, Huang G. Recent developments of biodegradable and biocompatible materials based micro/nanoparticles for delivering macromolecular therapeutics. Crit Rev Ther Drug Carrier Syst. 2009;26:29–84. - PubMed

Publication types