Construction and analysis of gene-gene dynamics influence networks based on a Boolean model
- PMID: 29322926
- PMCID: PMC5763298
- DOI: 10.1186/s12918-017-0509-y
Construction and analysis of gene-gene dynamics influence networks based on a Boolean model
Abstract
Background: Identification of novel gene-gene relations is a crucial issue to understand system-level biological phenomena. To this end, many methods based on a correlation analysis of gene expressions or structural analysis of molecular interaction networks have been proposed. They have a limitation in identifying more complicated gene-gene dynamical relations, though.
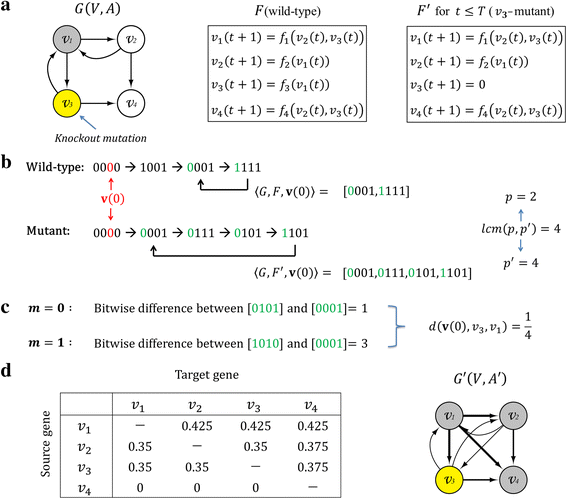
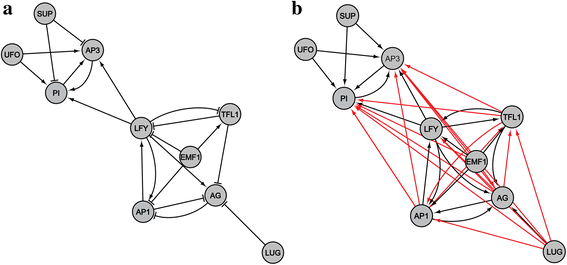
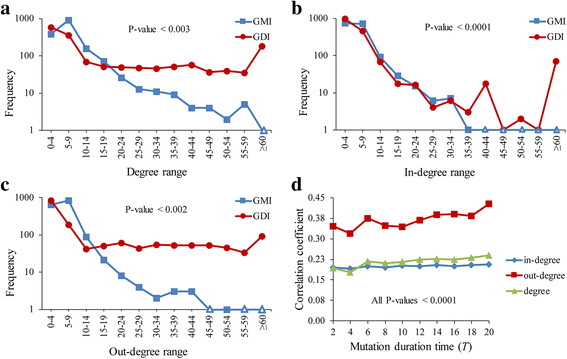
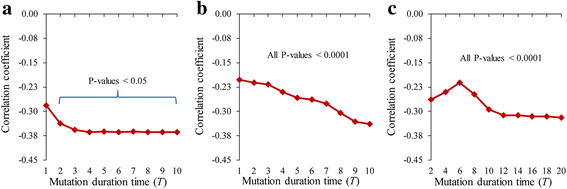
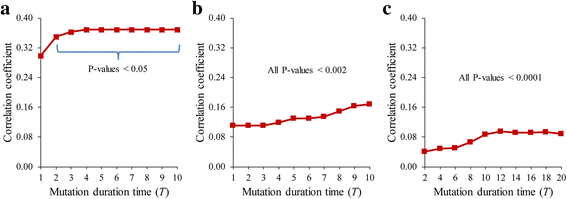
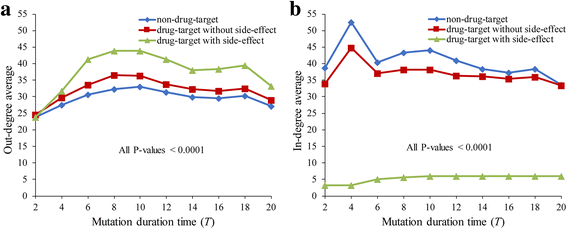
Results: To overcome this limitation, we proposed a measure to quantify a gene-gene dynamical influence (GDI) using a Boolean network model and constructed a GDI network to indicate existence of a dynamical influence for every ordered pair of genes. It represents how much a state trajectory of a target gene is changed by a knockout mutation subject to a source gene in a gene-gene molecular interaction (GMI) network. Through a topological comparison between GDI and GMI networks, we observed that the former network is denser than the latter network, which implies that there exist many gene pairs of dynamically influencing but molecularly non-interacting relations. In addition, a larger number of hub genes were generated in the GDI network. On the other hand, there was a correlation between these networks such that the degree value of a node was positively correlated to each other. We further investigated the relationships of the GDI value with structural properties and found that there are negative and positive correlations with the length of a shortest path and the number of paths, respectively. In addition, a GDI network could predict a set of genes whose steady-state expression is affected in E. coli gene-knockout experiments. More interestingly, we found that the drug-targets with side-effects have a larger number of outgoing links than the other genes in the GDI network, which implies that they are more likely to influence the dynamics of other genes. Finally, we found biological evidences showing that the gene pairs which are not molecularly interacting but dynamically influential can be considered for novel gene-gene relationships.
Conclusion: Taken together, construction and analysis of the GDI network can be a useful approach to identify novel gene-gene relationships in terms of the dynamical influence.
Keywords: Boolean dynamics; Gene-gene dynamics influence (GDI); Gene-gene molecular interaction (GMI) networks; Knockout mutation; Structural characteristics.
Conflict of interest statement
Ethics approval and consent to participate
Not applicable
Consent for publication
Not applicable
Competing interests
The authors declare that they have no competing interests.
Publisher’s Note
Springer Nature remains neutral with regard to jurisdictional claims in published maps and institutional affiliations.
Figures
Similar articles
-
In Silico Pleiotropy Analysis in KEGG Signaling Networks Using a Boolean Network Model.Biomolecules. 2022 Aug 18;12(8):1139. doi: 10.3390/biom12081139. Biomolecules. 2022. PMID: 36009032 Free PMC article.
-
Effects of ordered mutations on dynamics in signaling networks.BMC Med Genomics. 2020 Feb 20;13(Suppl 4):13. doi: 10.1186/s12920-019-0651-z. BMC Med Genomics. 2020. PMID: 32075651 Free PMC article.
-
Stochastic Boolean networks: an efficient approach to modeling gene regulatory networks.BMC Syst Biol. 2012 Aug 28;6:113. doi: 10.1186/1752-0509-6-113. BMC Syst Biol. 2012. PMID: 22929591 Free PMC article.
-
A novel constrained genetic algorithm-based Boolean network inference method from steady-state gene expression data.Bioinformatics. 2021 Jul 12;37(Suppl_1):i383-i391. doi: 10.1093/bioinformatics/btab295. Bioinformatics. 2021. PMID: 34252959 Free PMC article.
-
Boolean modeling techniques for protein co-expression networks in systems medicine.Expert Rev Proteomics. 2016 Jun;13(6):555-69. doi: 10.1080/14789450.2016.1181546. Epub 2016 May 6. Expert Rev Proteomics. 2016. PMID: 27105325 Review.
Cited by
-
In Silico Pleiotropy Analysis in KEGG Signaling Networks Using a Boolean Network Model.Biomolecules. 2022 Aug 18;12(8):1139. doi: 10.3390/biom12081139. Biomolecules. 2022. PMID: 36009032 Free PMC article.
-
A bioinformatics potpourri.BMC Genomics. 2018 Jan 19;19(Suppl 1):920. doi: 10.1186/s12864-017-4326-x. BMC Genomics. 2018. PMID: 29363432 Free PMC article.
-
Effects of ordered mutations on dynamics in signaling networks.BMC Med Genomics. 2020 Feb 20;13(Suppl 4):13. doi: 10.1186/s12920-019-0651-z. BMC Med Genomics. 2020. PMID: 32075651 Free PMC article.
References
-
- Mallet J. Epistasis and the evolutionary process. Science. 2001;291:602–2.
Publication types
MeSH terms
LinkOut - more resources
Full Text Sources
Other Literature Sources

