

Inference on phenotype-specific effects of genes using multivariate kernel machine regression
- PMID: 29314255
- PMCID: PMC5768462
- DOI: 10.1002/gepi.22096
Inference on phenotype-specific effects of genes using multivariate kernel machine regression
Abstract
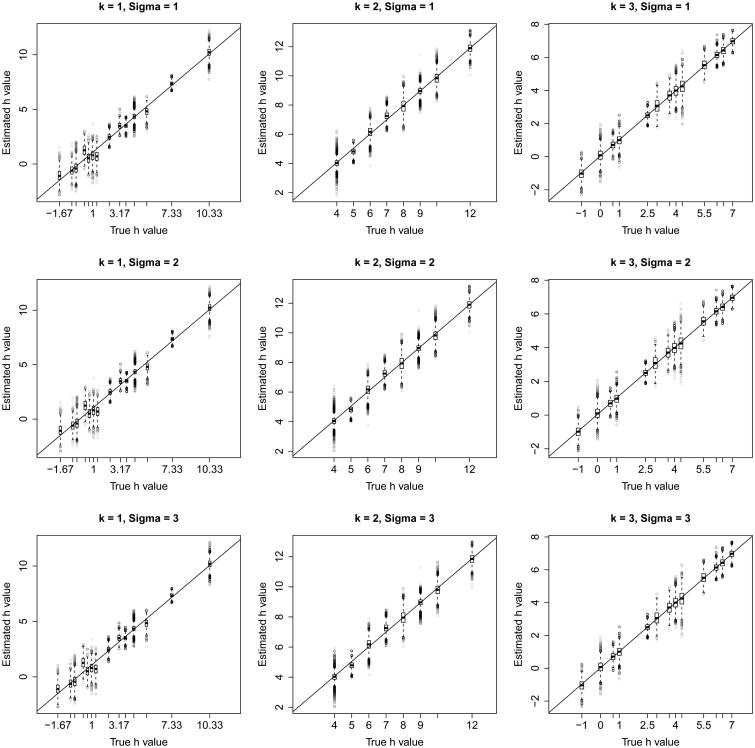
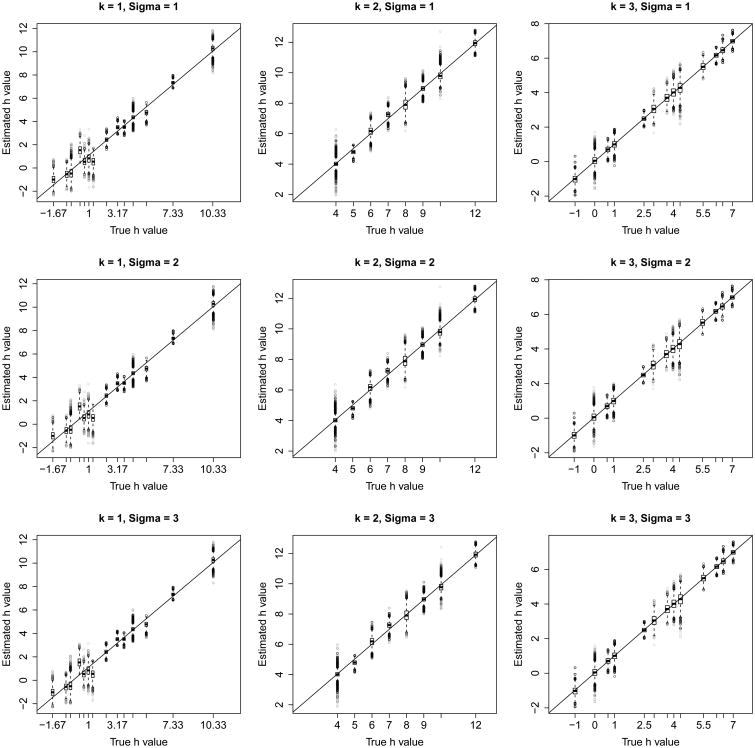
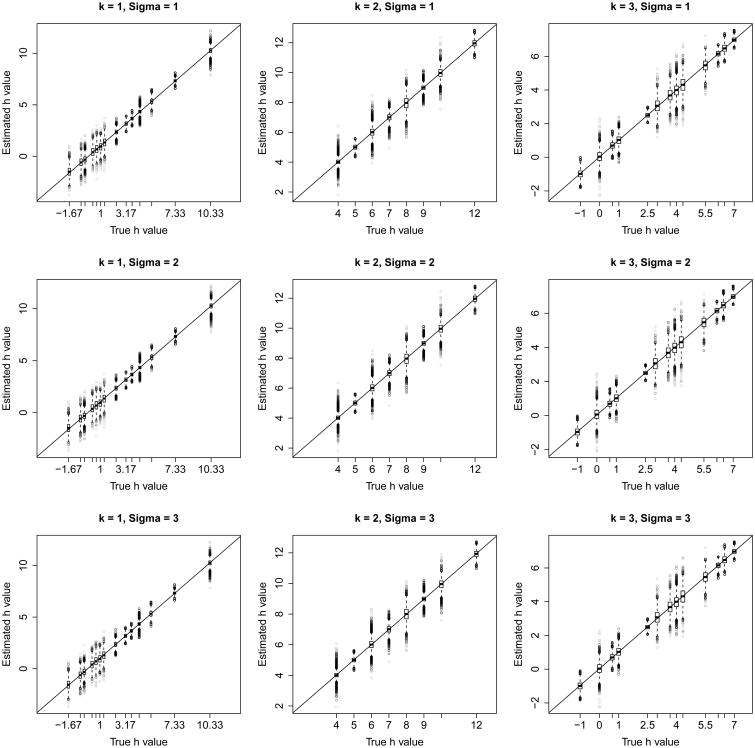
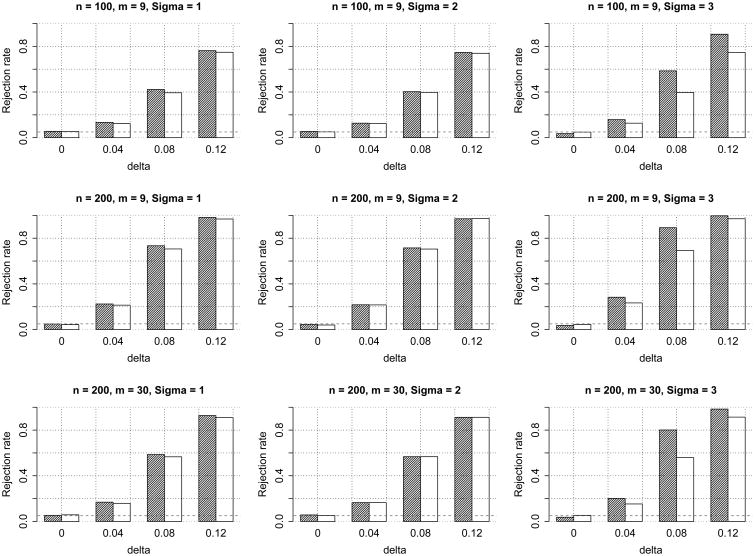
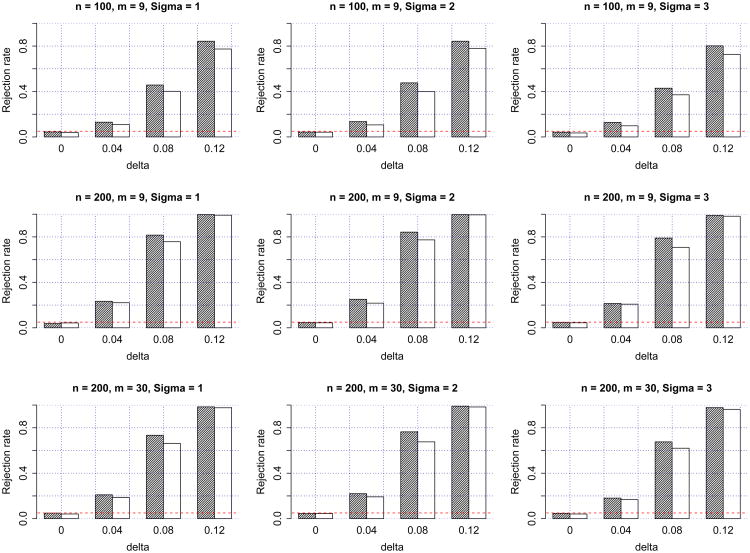
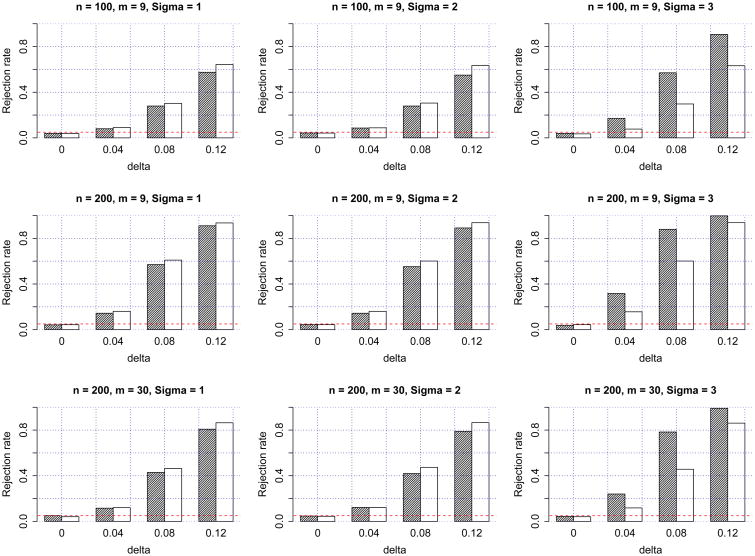
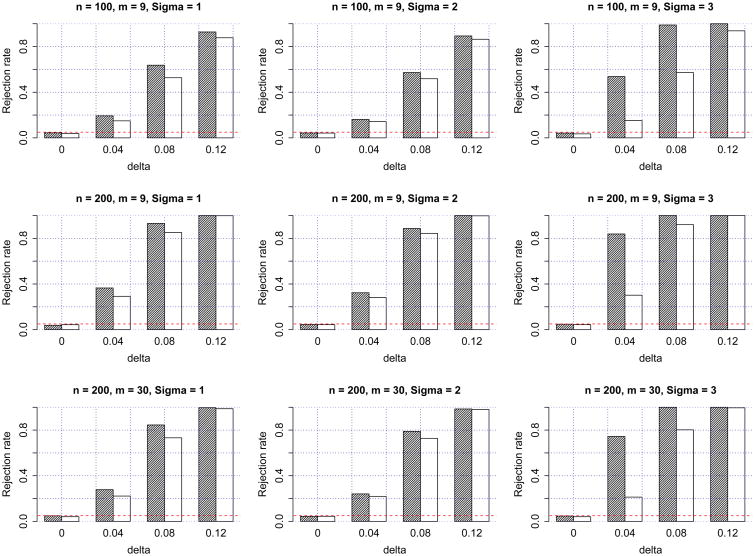
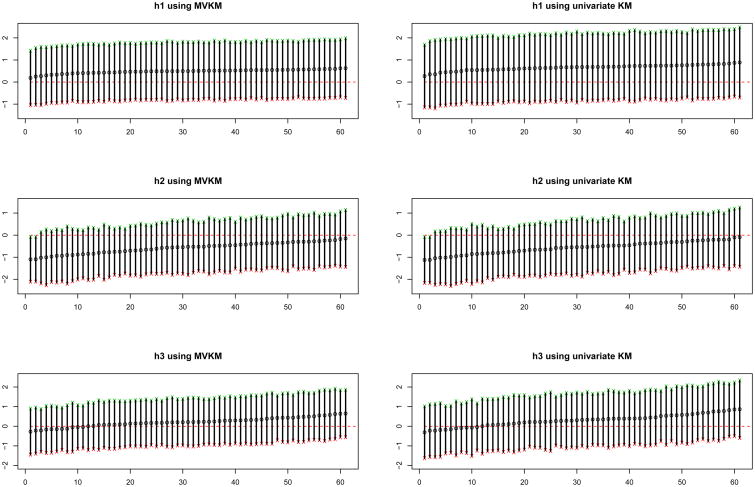
We consider the problem of assessing the joint effect of a set of genetic markers on multiple, possibly correlated phenotypes of interest. We develop a kernel machine based multivariate regression framework, where the joint effect of the marker set on each of the phenotypes is modeled using prespecified kernel functions with unknown variance components. Unlike most existing methods that mainly focus on the global association between the marker set and the phenotype set, we develop estimation and testing procedures to study phenotype-specific associations. Specifically, we develop an estimation method based on the penalized likelihood approach to estimate phenotype-specific effects and their corresponding standard errors while accounting for possible correlation among the phenotypes. We develop testing procedures for the association of the marker set with any subset of phenotypes using a score-based variance components testing method. We assess the performance of our proposed methodology via a simulation study and demonstrate the utility of the proposed method using the Clinical Antipsychotic Trials of Intervention Effectiveness (CATIE) data.
Keywords: kernel machine; mixed models; multivariate regression; restricted maximum likelihood; variance components.
© 2018 WILEY PERIODICALS, INC.
Conflict of interest statement
The authors have no conflict of interest.
Figures
Similar articles
-
Multivariate phenotype association analysis by marker-set kernel machine regression.Genet Epidemiol. 2012 Nov;36(7):686-95. doi: 10.1002/gepi.21663. Epub 2012 Aug 16. Genet Epidemiol. 2012. PMID: 22899176 Free PMC article.
-
Identifying genetic marker sets associated with phenotypes via an efficient adaptive score test.Biostatistics. 2012 Sep;13(4):776-90. doi: 10.1093/biostatistics/kxs015. Epub 2012 Jun 25. Biostatistics. 2012. PMID: 22734045 Free PMC article.
-
Composite kernel machine regression based on likelihood ratio test for joint testing of genetic and gene-environment interaction effect.Biometrics. 2019 Jun;75(2):625-637. doi: 10.1111/biom.13003. Epub 2019 Mar 30. Biometrics. 2019. PMID: 30430548
-
A small-sample multivariate kernel machine test for microbiome association studies.Genet Epidemiol. 2017 Apr;41(3):210-220. doi: 10.1002/gepi.22030. Epub 2016 Dec 26. Genet Epidemiol. 2017. PMID: 28019040
-
The estimation of genetic relationships using molecular markers and their efficiency in estimating heritability in natural populations.Philos Trans R Soc Lond B Biol Sci. 2005 Jul 29;360(1459):1457-67. doi: 10.1098/rstb.2005.1675. Philos Trans R Soc Lond B Biol Sci. 2005. PMID: 16048788 Free PMC article. Review.
References
-
- Christensen R. Plane Answers to Complex Questions. Springer-Verlag; New York: 2011.
-
- Davies RB. Algorithm as 155: The distribution of a linear combination of χ2 random variables. Journal of the Royal Statistical Society Series C (Applied Statistics) 1980;3(29):323–333.
-
- Keefe RSE, Bilder RM, Harvey PD, et al. Baseline neurocognitive deficits in the catie schizophrenia trial. Neuropsychopharmacology. 2006;31:2033–2046. - PubMed
Publication types
MeSH terms
Substances
Grants and funding
LinkOut - more resources
Full Text Sources
Other Literature Sources
