Leptin Mediates a Glucose-Fatty Acid Cycle to Maintain Glucose Homeostasis in Starvation
- PMID: 29307489
- PMCID: PMC5766366
- DOI: 10.1016/j.cell.2017.12.001
Leptin Mediates a Glucose-Fatty Acid Cycle to Maintain Glucose Homeostasis in Starvation
Abstract
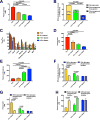
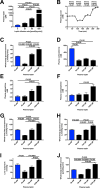
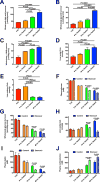
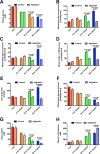
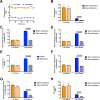
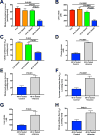
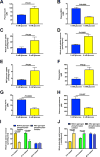
The transition from the fed to the fasted state necessitates a shift from carbohydrate to fat metabolism that is thought to be mostly orchestrated by reductions in plasma insulin concentrations. Here, we show in awake rats that insulinopenia per se does not cause this transition but that both hypoleptinemia and insulinopenia are necessary. Furthermore, we show that hypoleptinemia mediates a glucose-fatty acid cycle through activation of the hypothalamic-pituitary-adrenal axis, resulting in increased white adipose tissue (WAT) lipolysis rates and increased hepatic acetyl-coenzyme A (CoA) content, which are essential to maintain gluconeogenesis during starvation. We also show that in prolonged starvation, substrate limitation due to reduced rates of glucose-alanine cycling lowers rates of hepatic mitochondrial anaplerosis, oxidation, and gluconeogenesis. Taken together, these data identify a leptin-mediated glucose-fatty acid cycle that integrates responses of the muscle, WAT, and liver to promote a shift from carbohydrate to fat oxidation and maintain glucose homeostasis during starvation.
Keywords: HPA axis; glucose-alanine cycling; leptin; starvation.
Copyright © 2017 Elsevier Inc. All rights reserved.
Figures
Comment in
-
Metabolism: Leptin's role in starvation.Nat Rev Endocrinol. 2018 Mar;14(3):129. doi: 10.1038/nrendo.2018.6. Epub 2018 Jan 19. Nat Rev Endocrinol. 2018. PMID: 29348478 No abstract available.
Similar articles
-
The Role of Leptin in Maintaining Plasma Glucose During Starvation.Postdoc J. 2018 Mar;6(3):3-19. doi: 10.14304/surya.jpr.v6n3.2. Postdoc J. 2018. PMID: 29682594 Free PMC article.
-
Leptin revisited: The role of leptin in starvation.Mol Cell Oncol. 2018 May 29;5(5):e1435185. doi: 10.1080/23723556.2018.1435185. eCollection 2018. Mol Cell Oncol. 2018. PMID: 30263938 Free PMC article.
-
Effect of starvation on hepatic acyl-CoA synthetase, carnitine palmitoyltransferase-I, and acetyl-CoA carboxylase mRNA levels in rats.Nutrition. 2005 Apr;21(4):537-42. doi: 10.1016/j.nut.2004.08.015. Nutrition. 2005. PMID: 15811777
-
[Regulation of biosynthesis and oxidation of fatty acids and glycerides at the cellular level in mammalian tissues].Vopr Med Khim. 1974 Sep-Oct;20(5):451-62. Vopr Med Khim. 1974. PMID: 4156442 Review. Russian. No abstract available.
-
Yin and Yang of hypothalamic insulin and leptin signaling in regulating white adipose tissue metabolism.Rev Endocr Metab Disord. 2011 Sep;12(3):235-43. doi: 10.1007/s11154-011-9190-4. Rev Endocr Metab Disord. 2011. PMID: 21713385 Free PMC article. Review.
Cited by
-
LC-MS/MS-based bioanalysis of branched-chain and aromatic amino acids in human serum.Bioanalysis. 2024;16(13):693-704. doi: 10.1080/17576180.2024.2387467. Epub 2024 Aug 19. Bioanalysis. 2024. PMID: 39157863
-
Dissociation of Muscle Insulin Resistance from Alterations in Mitochondrial Substrate Preference.Cell Metab. 2020 Nov 3;32(5):726-735.e5. doi: 10.1016/j.cmet.2020.09.008. Epub 2020 Oct 8. Cell Metab. 2020. PMID: 33035493 Free PMC article.
-
The integrative biology of type 2 diabetes.Nature. 2019 Dec;576(7785):51-60. doi: 10.1038/s41586-019-1797-8. Epub 2019 Dec 4. Nature. 2019. PMID: 31802013 Review.
-
Regulation of hepatic mitochondrial oxidation by glucose-alanine cycling during starvation in humans.J Clin Invest. 2019 Nov 1;129(11):4671-4675. doi: 10.1172/JCI129913. J Clin Invest. 2019. PMID: 31545298 Free PMC article.
-
The mitochondrial β-oxidation enzyme HADHA restrains hepatic glucagon response by promoting β-hydroxybutyrate production.Nat Commun. 2022 Jan 19;13(1):386. doi: 10.1038/s41467-022-28044-x. Nat Commun. 2022. PMID: 35046401 Free PMC article.
References
-
- Ahima RS, Prabakaran D, Mantzoros C, Qu D, Lowell B, Maratos-Flier E, Flier JS. Role of leptin in the neuroendocrine response to fasting. Nature. 1996;382:250–252. - PubMed
-
- Benedict FG. A study of prolonged fasting. Carnegie Inst Wash Pub. 1907;77:66.
-
- Bligh EG, Dyer WJ. A rapid method of total lipid extraction and purification. Canadian journal of biochemistry and physiology. 1959;37:911–917. - PubMed
-
- Cahill GF., Jr Starvation in man. The New England journal of medicine. 1970;282:668–675. - PubMed
Publication types
MeSH terms
Substances
Grants and funding
- T32 DK101019/DK/NIDDK NIH HHS/United States
- R01 DK113984/DK/NIDDK NIH HHS/United States
- U24 DK059635/DK/NIDDK NIH HHS/United States
- R01 NS087568/NS/NINDS NIH HHS/United States
- R01 DK040936/DK/NIDDK NIH HHS/United States
- R01 AG023686/AG/NIA NIH HHS/United States
- P30 DK045735/DK/NIDDK NIH HHS/United States
- K99 CA215315/CA/NCI NIH HHS/United States
- UL1 TR000142/TR/NCATS NIH HHS/United States
- HHMI/Howard Hughes Medical Institute/United States
- R00 CA215315/CA/NCI NIH HHS/United States
- UL1 TR001863/TR/NCATS NIH HHS/United States
LinkOut - more resources
Full Text Sources
Other Literature Sources
Medical

