. 2018 Feb 27;38(6):e00484-17.
doi: 10.1128/MCB.00484-17. Print 2018 Mar 15.

MOF Suppresses Replication Stress and Contributes to Resolution of Stalled Replication Forks

Affiliations

MOF Suppresses Replication Stress and Contributes to Resolution of Stalled Replication Forks

Dharmendra Kumar Singh et al. Mol Cell Biol. .

Abstract

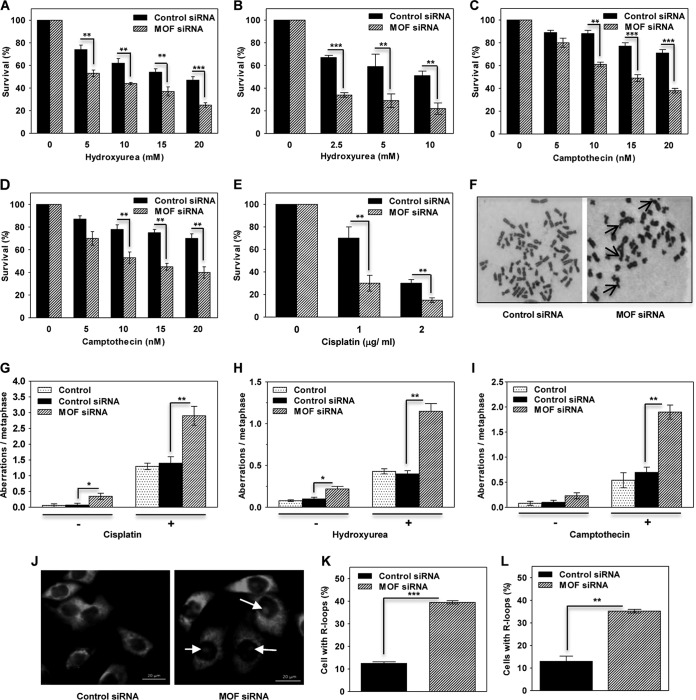
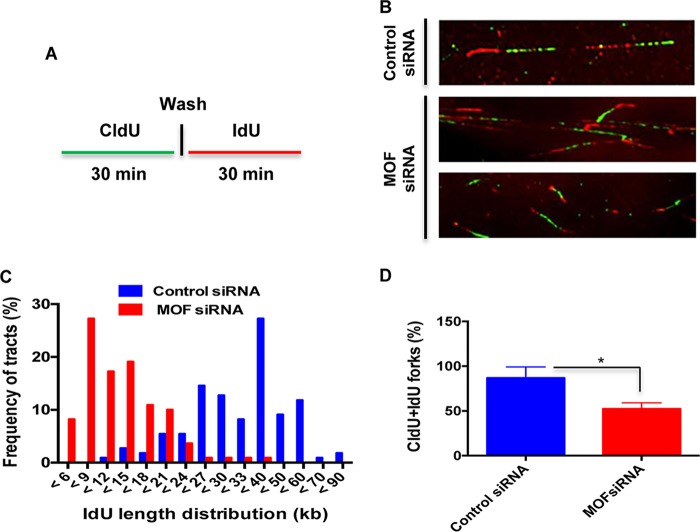
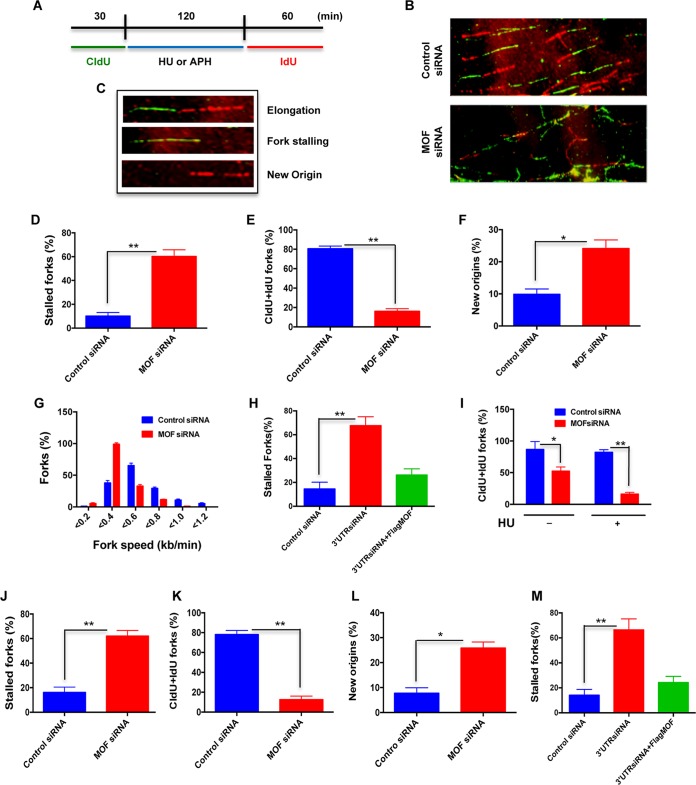
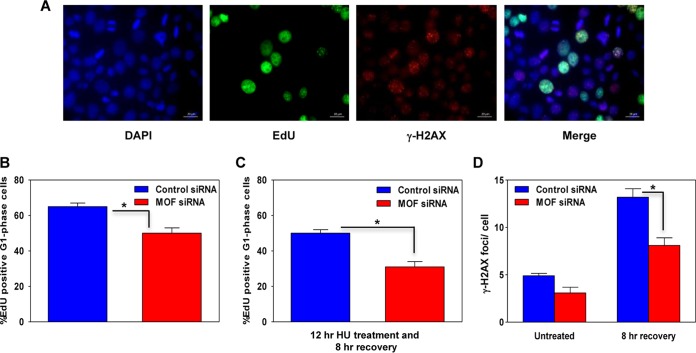
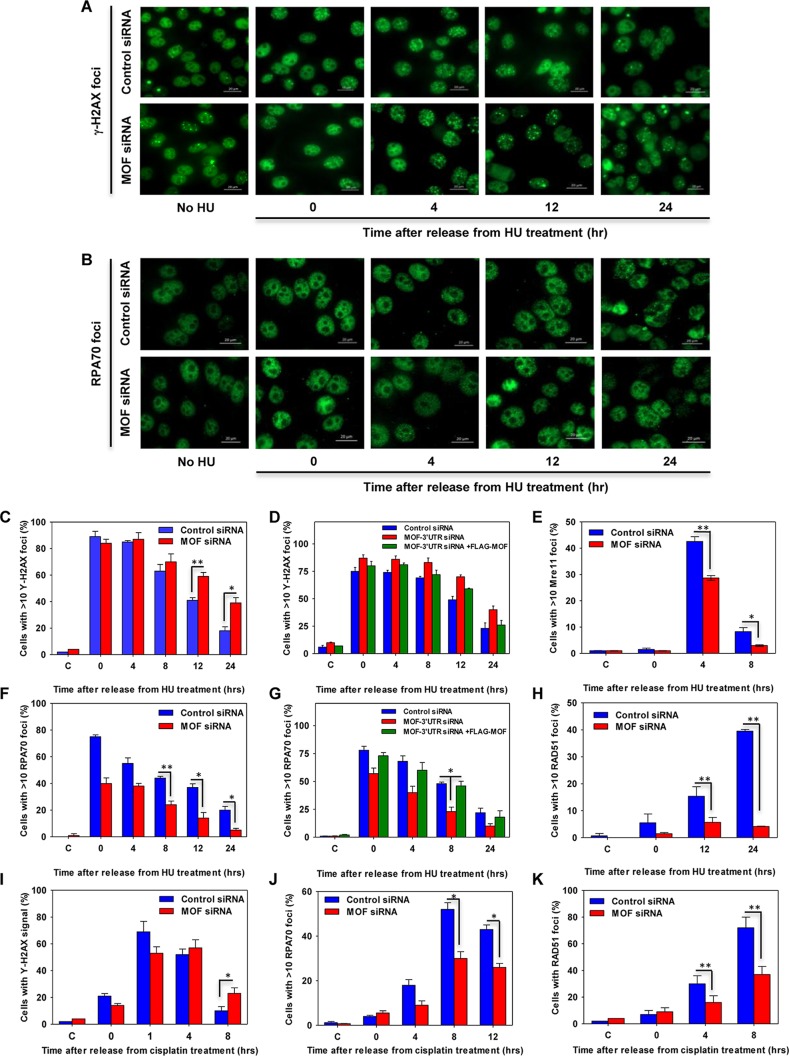
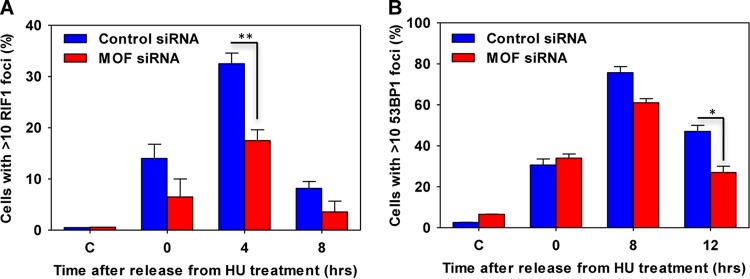
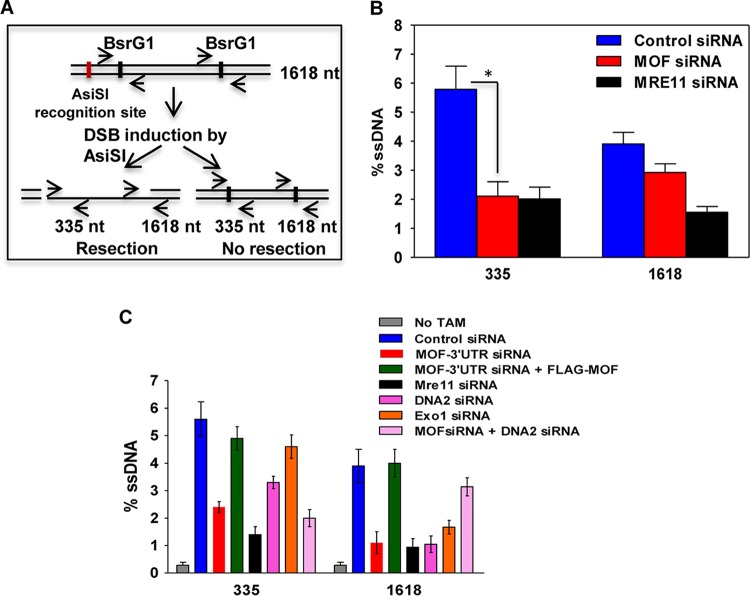
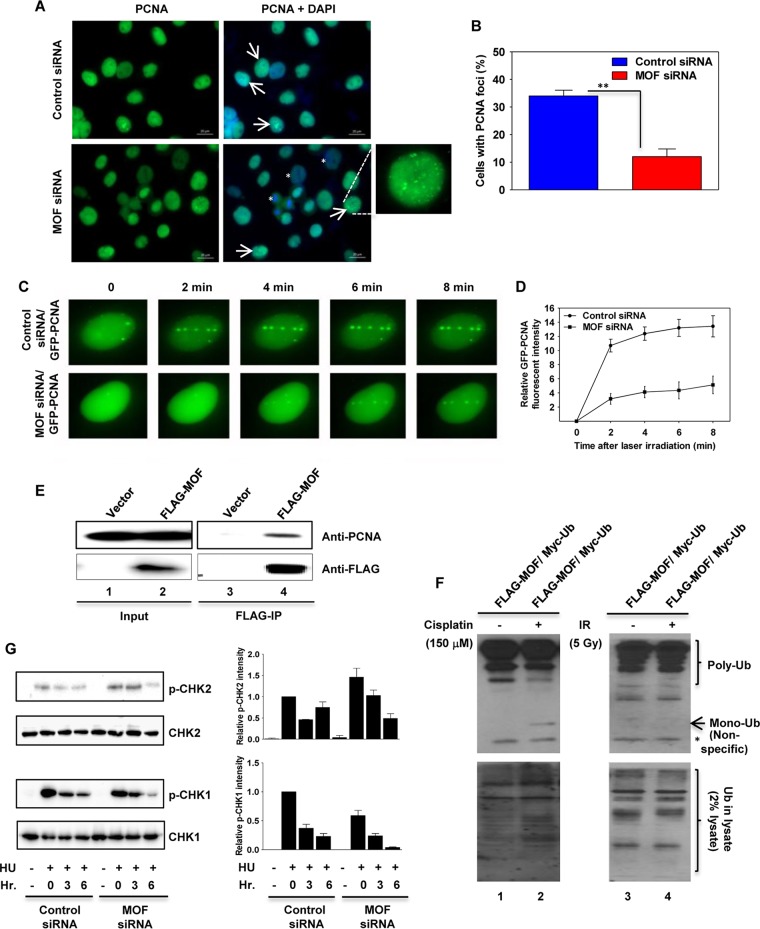
The human MOF (hMOF) protein belongs to the MYST family of histone acetyltransferases and plays a critical role in transcription and the DNA damage response. MOF is essential for cell proliferation; however, its role during replication and replicative stress is unknown. Here we demonstrate that cells depleted of MOF and under replicative stress induced by cisplatin, hydroxyurea, or camptothecin have reduced survival, a higher frequency of S-phase-specific chromosome damage, and increased R-loop formation. MOF depletion decreased replication fork speed and, when combined with replicative stress, also increased stalled replication forks as well as new origin firing. MOF interacted with PCNA, a key coordinator of replication and repair machinery at replication forks, and affected its ubiquitination and recruitment to the DNA damage site. Depletion of MOF, therefore, compromised the DNA damage repair response as evidenced by decreased Mre11, RPA70, Rad51, and PCNA focus formation, reduced DNA end resection, and decreased CHK1 phosphorylation in cells after exposure to hydroxyurea or cisplatin. These results support the argument that MOF plays an important role in suppressing replication stress induced by genotoxic agents at several stages during the DNA damage response.

Keywords: MOF; PCNA; R loop; homologous recombination; replication stress.


Figures

FIG 1
FIG 1
Cells depleted of MOF are sensitive to replication stress induced by cisplatin, hydroxyurea, or camptothecin. (A and B) Clonogenic survival of MOF-depleted HeLa (A) and U2OS (B) cells treated with the indicated concentrations of HU. (C and D) Clonogenic survival of MOF-depleted HeLa (C) and U2OS (D) cells treated with indicated concentrations of CPT. (E) Clonogenic survival of MOF-depleted HeLa cells treated with the indicated concentrations of cisplatin. The experiments were performed in triplicate, and the error bars represent the standard deviation from three independent experiments. P values: **, <0.01; ***, <0.001. (F) Representative images of metaphase spread of cells with control siRNA (untreated) and MOF-depleted (cisplatin-treated) HeLa cells showing various kinds of chromosomal aberrations. Arrows indicate aberrations. (G to I) Bar graphs show the chromosomal aberrations in control and MOF-depleted HeLa cells treated with either 50 μM cisplatin for 1 h (G), 2 mM HU for 24 h (H), or 250 nM CPT for 6 h (I). “Control” refers to cells that were not transfected with siRNA. The error bars represent the standard deviation from three independent experiments. P values: *, <0.05; **, <0.01. (J) Representative images of cells with R loops in control and MOF-depleted cells. Arrows indicate endogenous R loops detected by S9.6 antibody staining, which specifically detects DNA-RNA hybrids. (K and L) Bar graphs show the quantification of the percentages of cells showing endogenous R loops in control and MOF-depleted HeLa (K) and U2OS (L) cells. The error bars represent the standard deviation from three independent experiments. P values: **, <0.01; ***, <0.001.
FIG 2
FIG 2
Replication fork progression is impaired in MOF-depleted cells. (A) Scheme of the single DNA fiber analysis. The control and MOF-depleted HeLa cells were labeled with CldU for 30 min, rinsed, and then labeled with IdU for 30 min before being subjected to DNA fiber analysis. (B) Representative images of DNA fiber tracts in control and MOF-depleted cells. The CldU and IdU tracts were visualized in green and red, respectively. (C) Graph representing the frequency of IdU tract length distributions in control and MOF-depleted cells. (D) Bar graph showing the frequency of DNA fiber tracts with contiguous CldU and IdU labels at the replication fork. The experiments were performed three or four times, and for each time approximately 300 fibers were counted. Error bars represent the standard deviation from three independent experiments, with a P value of <0.05 (*) suggesting that the data have statistical significance.
FIG 3
FIG 3
Depletion of MOF decreases replication restart after replicative stress. (A) Scheme for dual labeling of DNA fibers to evaluate replication restart or recovery following HU- or APH-induced replication fork stalling. (B) Representative images of DNA fiber tracts in control and MOF-depleted cells after HU treatment. CldU tracts were visualized in green and IdU was visualized in red in control and MOF-depleted cells. (C) Examples of DNA fiber tract types representing elongation, stalled fork, and new origins. (D to G) Quantitative analysis of the DNA fiber replication restart assay after HU treatment. Bar graphs show the quantification of the percentage of stalled forks, total tracts with both CldU and IdU labels at the fork (CldU+IdU), percentage of new origins, and fork speed in control and MOF-depleted cells in panels D to G, respectively. The experiment was performed three times, and for each time point about 300 fibers were counted. Error bars represent the standard deviation from three independent experiments. P values are <0.05 (*) and <0.01 (**), showing that the values are statistically significant. (H) Quantitative analysis of replication restart after HU treatment in HeLa cells transfected with siRNA specific to the 3′ untranslated region (UTR) of the mof gene and ectopic expression of FLAG-MOF in these cells. (I) Bar graph showing the frequency of replication tracts with both CldU and IdU labels in the absence or presence of HU treatment in control and MOF-depleted cells. (J to L) Quantitative analysis of the DNA fiber assay following APH treatment. Bar graphs show the measurement of percentage of stalled forks, total tracts with both CldU and IdU labels at the fork (CldU+IdU), and percentage of new origins in control and MOF-depleted cells in panels J to L, respectively. (M) Quantitative analysis of the replication restart assay after APH treatment in cells transfected with siRNA specific to the 3′ UTR of the mof gene followed by ectopic FLAG-MOF expression.
FIG 4
FIG 4
Depletion of MOF delays S-phase progression. (A) Representative images of control and MOF-depleted HeLa cells coimmunostained for EdU (green) and γ-H2AX (red), with DAPI-stained nuclei in blue. (B) Graph showing the percentage of EdU-positive G1-phase cells in the asynchronous HeLa cell population in control and MOF-depleted cells after labeling with EdU for 30 min followed by growth of the cells under normal culture conditions for 8 h. (C) Quantification of the percentage of EdU-positive G1-phase cells in control and MOF-depleted cells pretreated with 1 mM HU for 12 h, followed by 8 h of recovery. (D) Numbers of large γ-H2AX foci, representing collapsed forks, in EdU-positive S-phase cells in control and MOF-depleted cells. Foci were counted in approximately 200-EdU positive cells per data set. The error bars represent the standard deviation from three independent experiments. The P value is <0.05 (*), indicating that the difference is statistically significant.
FIG 5
FIG 5
Homologous-recombination-mediated DNA repair is impaired in MOF-depleted cells. (A) Representative images of γ-H2AX focus formation at different time points after the release from HU treatment in control and MOF-depleted cells. (B) Representative images of RPA70 focus formation in control and MOF-depleted cells after HU treatment and release for different time points. (C to K) The control and MOF-depleted HeLa cells were treated with either 2 mM HU for 24 h or 50 μM cisplatin for 1 h and analyzed for focus formation of different HR proteins at various time intervals after the release from stress. (C, E, F, and H) Quantification of time-dependent γH2AX, Mre11, RPA70, and Rad51 focus formation, respectively, in control and MOF-depleted cells after treatment with HU. The experiments were performed two times for each protein, and for every time point approximately 150 cells were counted. P values: *, <0.05; **, <0.01. (D and G) Quantification of time-dependent γH2AX (D) and RPA70 (G) focus formation after HU treatment and release for different time points in control cells and cells transfected with 3′ UTR-specific MOF siRNA and depletion followed by ectopic FLAG-MOF expression. (I to K) Quantification of time-dependent γH2AX, RPA70, and Rad51 focus formation, respectively, in control and MOF-depleted cells after cisplatin treatment and release for different time points.
FIG 6
FIG 6
Nonhomologous end joining-mediated DNA repair is impaired in MOF-depleted cells. The bar graphs represent the RIF1 (A) and 53BP1 (B) focus formation after HU treatment and release for the indicated time points under normal growth conditions.
FIG 7
FIG 7
End resection at a DNA DSB site is inhibited in MOF-depleted cells. (A) Scheme of the experimental design. After site-specific DSB induction by ER-AsiSI, the amount of intermediate ssDNA generated in the cells was measured by quantitative PCR using site-specific primers flanking nucleotide positions 335 and 1618 downstream of the DSB induction site. (B) Quantification of the percent ssDNA in control and MOF-depleted cells by quantitative PCR. Mre11-depleted ER-AsiSI U2OS cells were used as a positive control for the experiment. The experiments were performed three times, and the error bars represent the standard deviation from three independent experiments. The P value is < 0.05 (*), indicating that the difference is statistically significant. (C) Quantification of the percent ssDNA in cells transfected with different siRNA as indicated.
FIG 8
FIG 8
MOF depletion reduces PCNA ubiquitination, delays PCNA recruitment to DNA damage sites, and inhibits CHK1 phosphorylation. (A) Recruitment of PCNA to DNA damage sites is decreased in MOF-depleted cells. Control and MOF-depleted HeLa cells were treated with HU for 24 h, and 12 h after release from HU treatment, the cells were immunostained with PCNA antibody. The cells with PCNA foci are marked with arrows. The enlarged image in the bottom right panel shows a representative image of the cells with PCNA foci. The less-PCNA-stained cells in MOF-depleted cells are marked with an asterisk. (B) Quantification of the percentage of cells with PCNA foci in control and MOF-depleted cells. Error bars represent the standard deviation from three independent experiments. P value: **, <0.01. (C) Recruitment of PCNA onto laser-induced DNA damage sites. Exponentially growing control and MOF-depleted HeLa cells were transfected with cDNA coding for EGFP-PCNA and then microirradiated, and time-lapse images were captured at different time intervals. (D) Kinetics of GFP-PCNA relative fluorescence intensity at the DNA damage sites measured in control and MOF-depleted HeLa cells at different time intervals after microirradiation. The experiments were performed two times, and each time about 50 cells was targeted with the laser and PCNA recruitment kinetics were measured. (E) FLAG-tagged MOF was used to coimmunoprecipitate endogenous PCNA (lane 4) from extracts prepared from transfected cells. The input and the IgG controls are shown in lanes 1 and 3, respectively. (F) FLAG-MOF and Myc-ubiquitin expression vectors were cotransfected into HeLa cells, followed by treatment with either cisplatin (150 μM) or IR (5 Gy). The increased PCNA monoubiquitylation induced by cisplatin is shown in lane 2. The monoubiquitinated band is marked with an arrow. The lowermost band, which is marked with an asterisk, corresponds to a nonspecific band. (G) The control and MOF-depleted HeLa cells were treated with HU and released from inhibition for the indicated times before being subjected to Western blotting with p-CHK1 and p-CHK2 antibodies. As a loading control, the same blots were reprobed with CHK1 and CHK2 antibodies. The bar graphs on the right show the Western blot quantification for the three independent experiments.

Similar articles

Cited by

References

    1. Mazouzi A, Velimezi G, Loizou JI. 2014. DNA replication stress: causes, resolution and disease. Exp Cell Res 329:85–93. doi:10.1016/j.yexcr.2014.09.030. - DOI - PubMed
    1. Zeman MK, Cimprich KA. 2014. Causes and consequences of replication stress. Nat Cell Biol 16:2–9. doi:10.1038/ncb2897. - DOI - PMC - PubMed
    1. Halazonetis TD, Gorgoulis VG, Bartek J. 2008. An oncogene-induced DNA damage model for cancer development. Science 319:1352–1355. doi:10.1126/science.1140735. - DOI - PubMed
    1. Groth A, Rocha W, Verreault A, Almouzni G. 2007. Chromatin challenges during DNA replication and repair. Cell 128:721–733. doi:10.1016/j.cell.2007.01.030. - DOI - PubMed
    1. Khurana S, Oberdoerffer P. 2015. Replication stress: a lifetime of epigenetic change. Genes (Basel) 6:858–877. doi:10.3390/genes6030858. - DOI - PMC - PubMed

Publication types

LinkOut - more resources