. 2018 Jan 2;9(1):21.
doi: 10.1038/s41467-017-02481-5.

Macrophages orchestrate breast cancer early dissemination and metastasis

Affiliations

Macrophages orchestrate breast cancer early dissemination and metastasis

Nina Linde et al. Nat Commun. .

Abstract

Cancer cell dissemination during very early stages of breast cancer proceeds through poorly understood mechanisms. Here we show, in a mouse model of HER2+ breast cancer, that a previously described sub-population of early-evolved cancer cells requires macrophages for early dissemination. Depletion of macrophages specifically during pre-malignant stages reduces early dissemination and also results in reduced metastatic burden at end stages of cancer progression. Mechanistically, we show that, in pre-malignant lesions, CCL2 produced by cancer cells and myeloid cells attracts CD206+/Tie2+ macrophages and induces Wnt-1 upregulation that in turn downregulates E-cadherin junctions in the HER2+ early cancer cells. We also observe macrophage-containing tumor microenvironments of metastasis structures in the pre-malignant lesions that can operate as portals for intravasation. These data support a causal role for macrophages in early dissemination that affects long-term metastasis development much later in cancer progression. A pilot analysis on human specimens revealed intra-epithelial macrophages and loss of E-cadherin junctions in ductal carcinoma in situ, supporting a potential clinical relevance.


Conflict of interest statement

The authors declare no competing financial interests.

Figures

Fig. 1
Fig. 1
Macrophages enter the ductal epithelial layer in early breast cancer lesions. H&E staining of mammary gland sections show progression from healthy mammary ducts in FVB wild-type glands (age 20wks; a) to early lesions classified as hyperplasia and mammary intra-epithelial neoplasia (age 22wks; b) to invasive tumors (age 26–30wks; c) in the MMTV-HER2 mouse model. Bars: 100 μm. Mammary glands from FVB wild-type (20wks; d) or pre-malignant MMTV-HER2 mice at age 14wks (e) and 22wks (f) were stained against F4/80 (macrophages) and CK8/18 (epithelial cells) and against F4/80 and smooth muscle actin (SMA) (g–i). Bars: 10 μm. The mean±SEM of the percentage of ducts containing IEM is shown; FVB: N = 4 mice, 14wks; N = 3 mice, 22wks; N = 5 mice (j). P values were calculated with 95% confidence by Mann–Whitney test
Fig. 2
Fig. 2
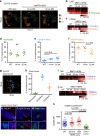
Intra-epithelial macrophages (IEMs) induce an EMT-like response in early cancer cells. Twenty-week-old MMTV-HER2 mouse mammary glands were stained against E-cadherin and F4/80. E-cadherin localization was analyzed dependent on whether macrophages did not make direct contact to the duct (no M. or distant M.; a) or whether ducts contain IEMs (b). The percentage of individual epithelial cells with disrupted E-cadherin was quantified in four mice and is shown as mean±SEM (c). Statistical analysis: Mann–Whitney test. E-cadherin mRNA expression in whole mammary glands of FVB wild-type (WT, 20wks, N = 4) or 20-week-old MMTV-HER2 (N = 7) mice was determined by qPCR and is shown as mean±SEM by Mann–Whitney test. d Twenty-four-week-old MMTV-HER2 mammary glands (N = 3 per group) were stained against β-catenin and Iba1, a macrophage marker. e, f β-Catenin+ early cancer cells (blue) were more frequent in ducts containing IEMs. g Plots shown as mean±SEM by Mann–Whitney test. The mammary epithelial cell line Comma-1D was grown as a monolayer before the addition of mCherry expressing Raw264.7 macrophages. E-cadherin (h) or β-catenin (i) was stained and the intra-nuclear signal intensity of β-catenin was quantified (j). Plots show nuclear β-catenin signal intensity in individual cells; independent experiments N = 3, Student’s t test. k, l Conditioned medium was harvested from primary mammospheres of 20–22-week-old WT or pre-malignant MMTV-HER2 mice and added to Raw264.7 macrophages or mammary tissue macrophages (MTMs) isolated from pre-malignant MMTV-HER2 mammary glands. Wnt-1 expression is depicted as mean±SEM of three technical replicates. Statistical significance was determined by Student’s t test with 95% confidence interval; individual experiments N = 3 for Raw264.7 and N = 2 for MTMs. Comma-1D cells were grown as monolayers (m) and Raw264.7-mCherry macrophages were added (n) and additionally treated with DKK1 (o). E-cadherin signal intensity in whole section was quantified and is shown as mean±SEM, where each dot represents one microscopic field; independent experiments N = 2, Student’s t test. The pixel intensity of the cells in (n) is background pixel signal for the green channel, ~1000 in pixel intensity
Fig. 3
Fig. 3
Macrophage depletion during pre-malignant stages prevents early cancer cell dissemination. Twenty-week-old pre-malignant MMTV-HER2 mice were treated with the anti-CSF1R ASF98 antibody and animals were harvested after 2 weeks with no signs of invasive carcinoma (a). Analysis of H&E staining of mammary gland sections confirmed the absence of invasive lesions (b, c; bars: 100 μm). E-cadherin expression in whole mammary glands was determined (d; mean±SEM; control 7, anti-CSF1R 6 animals; statistical analysis: Mann–Whitney test) and by immunofluorescent staining against E-cadherin in mammary gland sections (e, f; bars: 10 μm). E-cadherin signal intensity was measured in individual regions of cell junctions in three animals per group (g). P values were calculated with 95% confidence interval by Mann–Whitney test. Early circulating cancer cells (eCCCs) were quantified in mice per group as the amount of HER2 and CK8/18+ eCCs/ml peripheral blood. Values were normalized to the mean of controls and are shown as mean±SEM (h) depicts normalized mean±SEM; seven animals per group; statistical analysis: Mann–Whitney test. Disseminated HER2+ eCCs were quantified in lung sections (i, j; bars: 25 μM) and were quantified as the average of HER2+ cells per 100 randomly chosen microscopic fields (k). Mean±SEM are shown; statistical analysis: Mann–Whitney test
Fig. 4
Fig. 4
Early disseminated cancer cells contribute to metastasis formation. Macrophages were depleted from pre-malignant MMTV-HER2 mice by ASF98 treatment starting at week 18. Treatment was stopped when mice developed palpable tumors (1–3 mm average). a Mice were left until tumors reached 1 cm in diameter and then sacrificed. b Time from beginning of treatment at age wk18 until development of palpable tumors as mean±SEM (9 mice each, 23–38 wks old). c Time from formation of palpable tumors until tumors were overt (26-43 wks old) as mean±SEM (control N = 9, anti-CSF1R N = 6). Macrophages in sections of overt tumors (at least three animals per group) were identified by staining against F4/80 at the end of the experiment (d, e; bar: 100 μm; zoom factor in insets 5x) and quantified as the number of macrophages relative to tumor area (f; statistical analysis: Mann–Whitney test). Vascularization of overt tumors was analyzed by staining against endomucin, an endothelial cell marker (g, h; bar: 100 μm; zoom factor in insets 4x) and quantified as endomucin+ area/tumor in at least three animals combined (i; mean±SEM; statistical analysis: Mann–Whitney test). Solitary DCCs in lung sections and metastases defined as cell clusters bigger than three cells were quantified in lung sections stained against HER2 (jl, bar: 25 μm). For solitary cell analysis, the average of DCCs or metastases per 100 fields was counted; each dot represents one lung section. For metastasis analysis, the total number of metastases per lung sections was quantified and plotted (j). Number of mice N = 6 (control) and N = 4 (αCSF1R) animals combined; statistical analysis: Mann–Whitney test
Fig. 5
Fig. 5
Phenotypic profiling of immune cells in early mammary cancer lesions. a Whole mammary glands from FVB wild-type mice or 14-week-old and 22-week-old pre-malignant MMTV-HER2 mice were analyzed by mass cytometry. viSNE plots were generated from myelomonocytic cells (gating strategy see Supplementary Fig. 4A, B). Results from one representative animal is shown; number of animals per group N = 5; individual experiments N = 2. The three sub-populations were identified as Ly6C+ monocytes and CD206hi and CD206lo macrophages based on their expression levels of Ly6C (b) and CD206 (c). These three populations were then analyzed for their frequency amongst all myelomonocytic cells. df Dot plots show mean±SEM of five animals per group. Heat plots for three individual animals per group with expression levels of selected markers Ly6C (b), CD206 (c), Tie2 (i), and IdU incorporation as a proliferation marker (j) were generated for CD206lo and CD206hi macrophages as identified in the viSNE plots. g, h viSNE plot and quantification of myelomonocytic population in overt MMTV-HER2 tumors (five mice per group). Mammary glands from FVB wild-type mice (k, 22wks), MMTV-HER2 mice at 24wks (l) and overt MMTV-HER2 tumors (m, 26–30wks) were stained against CD206 and F4/80 and CD206 signal intensity in F4/80+ macrophages was quantified; zoom factor in k, l, and m, 2x. Plot n depicts mean±SEM, each dot represents one macrophage; three animals combined. All bars: 10 μm. All statistical testing was done with 95% confidence interval by Mann–Whitney test
Fig. 6
Fig. 6
HER2 activates NF-κB and upregulates CCL2. a Western blot for NF-κB subunit phospho-p65 in mammosphere (MS) lysates from 20-week-old MMTV-HER2 mice. One representative blot of three independent experiments is shown. b CCL2 expression in MS from FVB wild-type and pre-malignant MMTV-HER2 mammary glands (MGs). Technical replicates, three experiments (3 mice/group); statistical analysis: with 95% confidence interval by Mann–Whitney test. c MGs from FVB wild-type and 22-week-old MMTV-HER2 mice stained against CCL2, HER2, and CCR2. Bars: 25 μm. Inset, CCR2 signal, zoom factor 1x; full image in Supplementary Fig. 5i. CCL2 intensity was quantified using ROI tool in Metamorph (Supplementary Fig. 5h). d ELISA of CCL2 in 24 h conditioned media of WT or HER2+ MS isolated from two animals. P value with 95% confidence interval by Mann–Whitney test—SEM shown. eg CCL2 staining in acini cultures from MMTV-HER2 MGs (20–24 weeks (wks)) grown for 5 days and then DMSO-treated (vehicle control; e), 1 μM lapatinib (f) or 1 μM IKKi compound A (g) for 24 h. Bar: 25 μm. hj MG acini treated with DMSO (vehicle), lapatinib (1 μM), IKKi compound A (1 μM), or CCR2 inhibitor RS504393 (1 μM). Primary MG macrophages were then added and the percentage of acini associated with or without macrophages (h) was quantified (i; bar: 25 μm; zoom factor 2.6x); j mean±SEM; each dot one technical replicate; two independent experiments; statistical analysis: Mann–Whitney test—SEM shown). km Twenty-week-old MMTV-HER2 mice were treated with CCR2 inhibitior RS504393 (2 mg/kg i.p. daily) for 2 weeks and stained against E-cadherin and F4/80 (k, l; bars: 25 μm). m Intra-epithelial macrophage (IEM) containing ducts were quantified (with 95% confidence interval by Mann–Whitney test; each dot: mean±SEM of one animal). n Quantification of circulating cancer cells (CCC) in the mice in the experiment in km (statistical analysis: Mann–Whitney test—SEM shown). CCC quantification was performed as in Fig. 3h. o Twenty-week-old MMTV-HER2 mice were treated locally with 1 mg/kg CCR2 inhibitor injected into the MG fat pad every day for 5 days and vehicle control into the contra-lateral gland. Glands were stained against F4/80 and IEM containing ducts were quantified (o: 5 mice per group; statistical analysis: Mann–Whitney test—SEM shown). Values in o normalized to the IEM content of each contra-lateral control-treated gland
Fig. 7
Fig. 7
Intra-epithelial macrophage numbers in human DCIS lesions negatively correlate with E-cadherin levels. Human adjacent healthy (a) and DCIS tissue (b) was stained against CD68 (macrophages) and smooth muscle actin (SMA). Bar: 75 μm; zoom factor 4.75x. c Plot shows mean±SEM of the percentage of ducts containing intra-epithelial macrophages (IEMs) from 7 healthy and 10 DCIS patients; each dot represents one patient; statistical analysis: Mann–Whitney test. Sections from human DCIS tissue were stained against CD68 (macrophages) and E-cadherin (d, e, bar: 75 μm; zoom factor 4.1x). E-cadherin pixel intensity was quantified in regions of individual cell junctions and medians for individual patients were quantified. Plot f depicts mean E-cadherin intensity throughout DCIS lesions of individual patients with low or high intra-epithelial macrophage (IEM) numbers (total patient number N = 12; statistical analysis: Mann–Whitney test—SEM shown)
Fig. 8
Fig. 8
Models summarizing findings and potential scenarios for early DCC role in metastasis development. a Scheme of macrophage-regulated early dissemination from pre-invasive lesions where CCR2+/CD206hi/F4/80hi/Tie2hi macrophages are attracted into early lesions by HER2-mediated and NF-κB-mediated upregulation of CCL2. Our models support that intra-epithelial macrophages in turn secrete Wnt-1 in response to CCL2 production by cancer cells and also other immune cells and thereby further cement an EMT-like response that is also stimulated by autocrine/paracrine production of other Wnt ligands, to drive early dissemination. b Early DCCs contribute to metastasis formation, either as a slow cycling seeds of metastasis (scenario 1) or by interacting with the microenvironment and/or later arriving DCCs to create a “pre-metastatic niche” that is eDCC-orchestrated and more permissive for the growth of late or early and late cancer cells (scenario 2)

Similar articles

Cited by

References

    1. Turajlic S, Swanton C. Metastasis as an evolutionary process. Science. 2016;352:169–175. doi: 10.1126/science.aaf2784. - DOI - PubMed
    1. Braun S, et al. A pooled analysis of bone marrow micrometastasis in breast cancer. N. Engl. J. Med. 2005;353:793–802. doi: 10.1056/NEJMoa050434. - DOI - PubMed
    1. Banys M, et al. Hematogenous and lymphatic tumor cell dissemination may be detected in patients diagnosed with ductal carcinoma in situ of the breast. Breast Cancer Res. Treat. 2012;131:801–808. doi: 10.1007/s10549-011-1478-2. - DOI - PubMed
    1. Schardt JA, et al. Genomic analysis of single cytokeratin-positive cells from bone marrow reveals early mutational events in breast cancer. Cancer Cell. 2005;8:227–239. doi: 10.1016/j.ccr.2005.08.003. - DOI - PubMed
    1. Sanger N, et al. Disseminated tumor cells in the bone marrow of patients with ductal carcinoma in situ. Int. J. Cancer. 2011;129:2522–2526. doi: 10.1002/ijc.25895. - DOI - PubMed

Publication types