

Effects of Acoustic Environment on Tinnitus Behavior in Sound-Exposed Rats
- PMID: 29294193
- PMCID: PMC5878151
- DOI: 10.1007/s10162-017-0651-7
Effects of Acoustic Environment on Tinnitus Behavior in Sound-Exposed Rats
Abstract
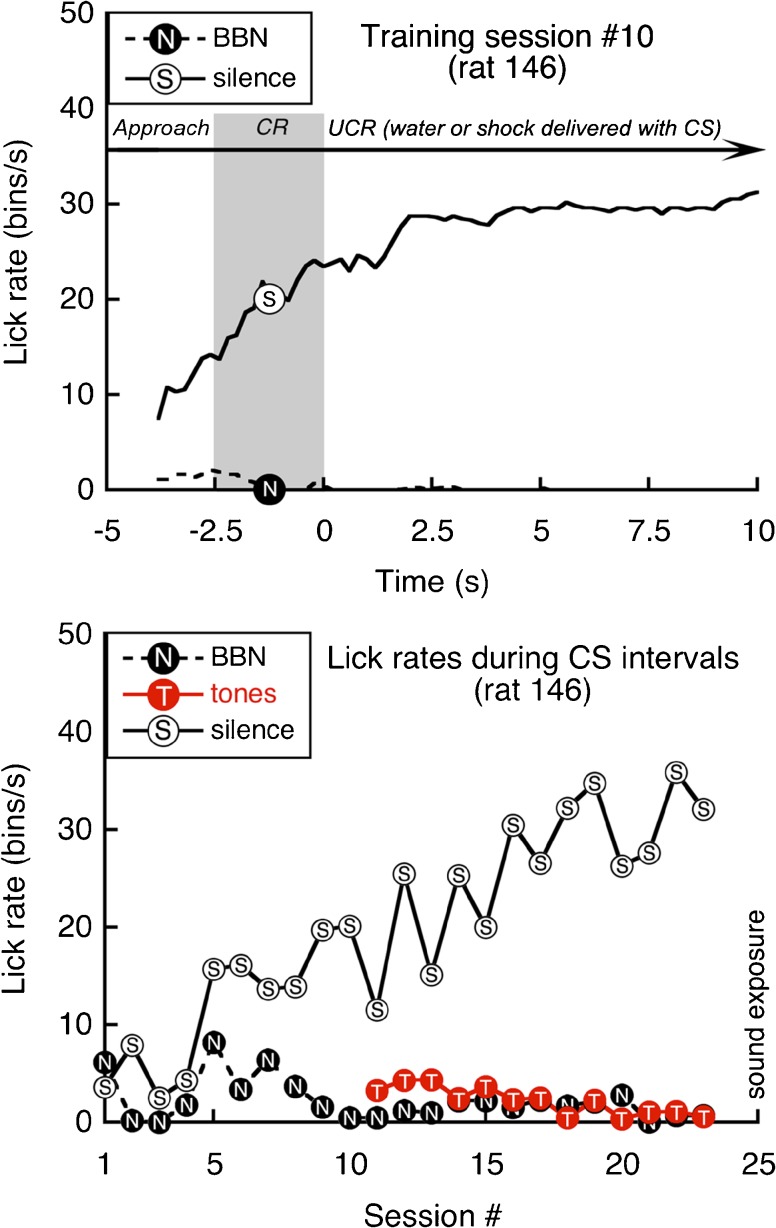
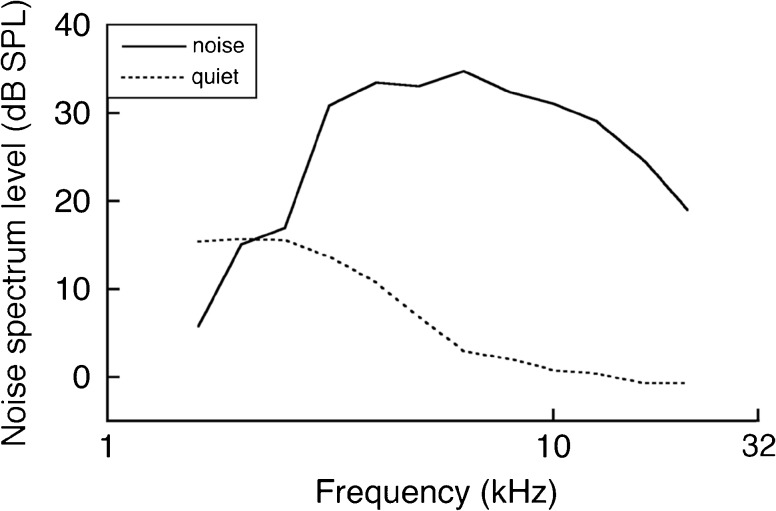
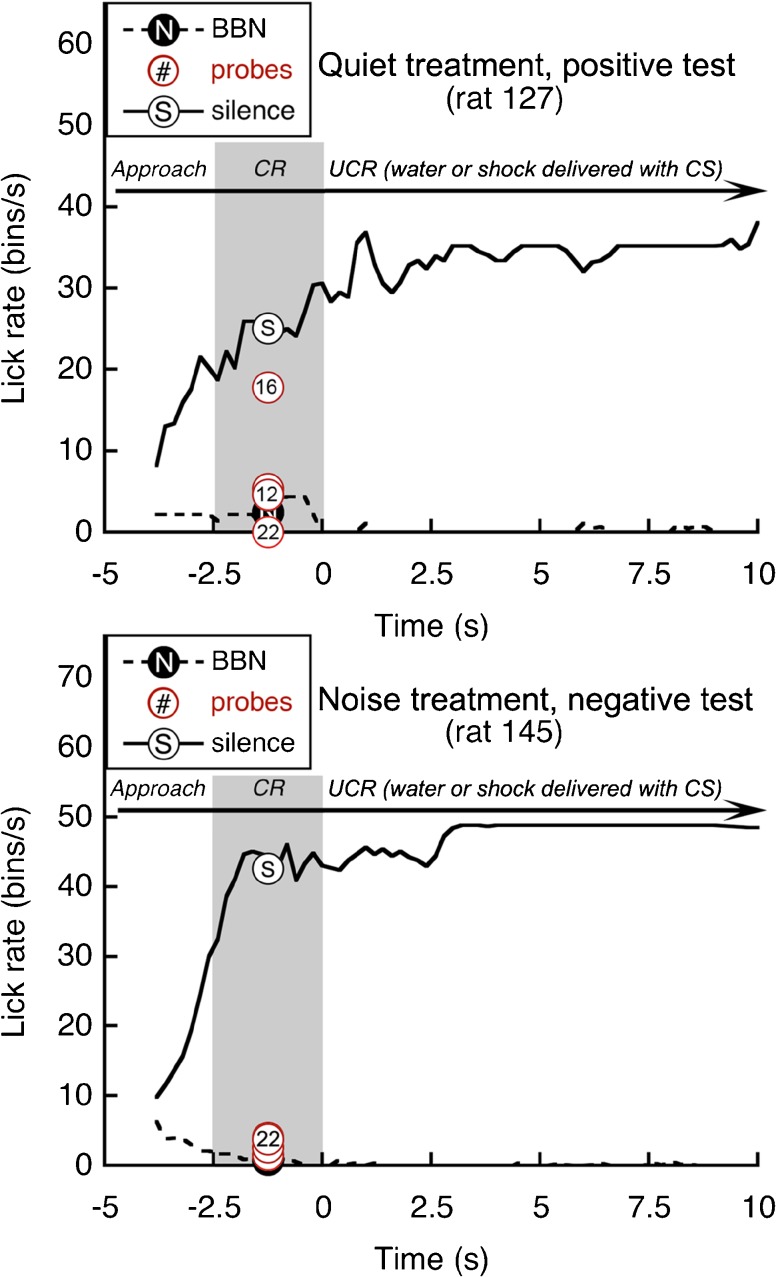
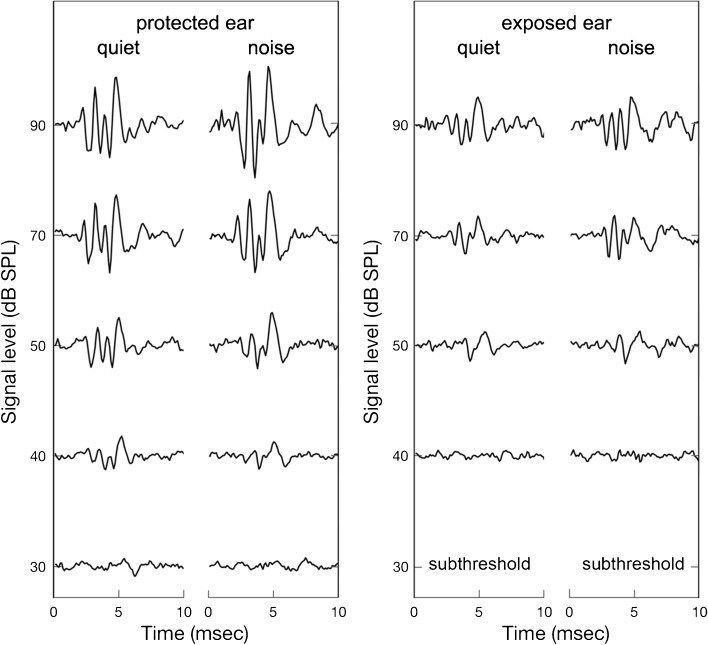
Laboratory studies often rely on a damaging sound exposure to induce tinnitus in animal models. Because the time course and ultimate success of the induction process is not known in advance, it is not unusual to maintain sound-exposed animals for months while they are periodically assessed for behavioral indications of the disorder. To demonstrate the importance of acoustic environment during this period of behavioral screening, sound-exposed rats were tested for tinnitus while housed under quiet or constant noise conditions. More than half of the quiet-housed rats developed behavioral indications of the disorder. None of the noise-housed rats exhibited tinnitus behavior during 2 months of behavioral screening. It is widely assumed that the "phantom sound" of tinnitus reflects abnormal levels of spontaneous activity in the central auditory pathways that are triggered by cochlear injury. Our results suggest that sustained patterns of noise-driven activity may prevent the injury-induced changes in central auditory processing that lead to this hyperactive state. From the perspective of laboratory studies of tinnitus, housing sound-exposed animals in uncontrolled noise levels may significantly reduce the success of induction procedures. From a broader clinical perspective, an early intervention with sound therapy may reduce the risk of tinnitus in individuals who have experienced an acute cochlear injury.
Keywords: hyperactivity; hyperacusis; sound therapy.
Conflict of interest statement
Conflict of Interest
The authors declare that they have no conflict of interest.
Figures
Similar articles
-
Prolonged Exposure of CBA/Ca Mice to Moderately Loud Noise Can Cause Cochlear Synaptopathy but Not Tinnitus or Hyperacusis as Assessed With the Acoustic Startle Reflex.Trends Hear. 2018 Jan-Dec;22:2331216518758109. doi: 10.1177/2331216518758109. Trends Hear. 2018. PMID: 29532738 Free PMC article.
-
Noise-induced tinnitus using individualized gap detection analysis and its relationship with hyperacusis, anxiety, and spatial cognition.PLoS One. 2013 Sep 12;8(9):e75011. doi: 10.1371/journal.pone.0075011. eCollection 2013. PLoS One. 2013. PMID: 24069375 Free PMC article.
-
A Conditioned Behavioral Paradigm for Assessing Onset and Lasting Tinnitus in Rats.PLoS One. 2016 Nov 11;11(11):e0166346. doi: 10.1371/journal.pone.0166346. eCollection 2016. PLoS One. 2016. PMID: 27835697 Free PMC article.
-
Psychophysical and neural correlates of noised-induced tinnitus in animals: Intra- and inter-auditory and non-auditory brain structure studies.Hear Res. 2016 Apr;334:7-19. doi: 10.1016/j.heares.2015.08.006. Epub 2015 Aug 20. Hear Res. 2016. PMID: 26299842 Review.
-
Advances in the neurobiology of hearing disorders: recent developments regarding the basis of tinnitus and hyperacusis.Prog Neurobiol. 2013 Dec;111:17-33. doi: 10.1016/j.pneurobio.2013.08.002. Epub 2013 Sep 6. Prog Neurobiol. 2013. PMID: 24012803 Review.
Cited by
-
Towards a Mechanistic-Driven Precision Medicine Approach for Tinnitus.J Assoc Res Otolaryngol. 2019 Apr;20(2):115-131. doi: 10.1007/s10162-018-00709-9. Epub 2019 Mar 1. J Assoc Res Otolaryngol. 2019. PMID: 30825037 Free PMC article. Review.
-
Small Arms Fire-like noise: Effects on Hearing Loss, Gap Detection and the Influence of Preventive Treatment.Neuroscience. 2019 May 21;407:32-40. doi: 10.1016/j.neuroscience.2018.07.027. Epub 2018 Jul 25. Neuroscience. 2019. PMID: 30053484 Free PMC article.
References
Publication types
MeSH terms
Grants and funding
LinkOut - more resources
Full Text Sources
Other Literature Sources
Medical
