

Overweight/obesity status in preschool children associates with worse asthma but robust improvement on inhaled corticosteroids
- PMID: 29273557
- PMCID: PMC6675020
- DOI: 10.1016/j.jaci.2017.09.043
Overweight/obesity status in preschool children associates with worse asthma but robust improvement on inhaled corticosteroids
Abstract
Background: Overweight/obesity (OW) is linked to worse asthma and poorer inhaled corticosteroid (ICS) response in older children and adults.
Objective: We sought to describe the relationships between OW and asthma severity and response to ICS in preschool children.
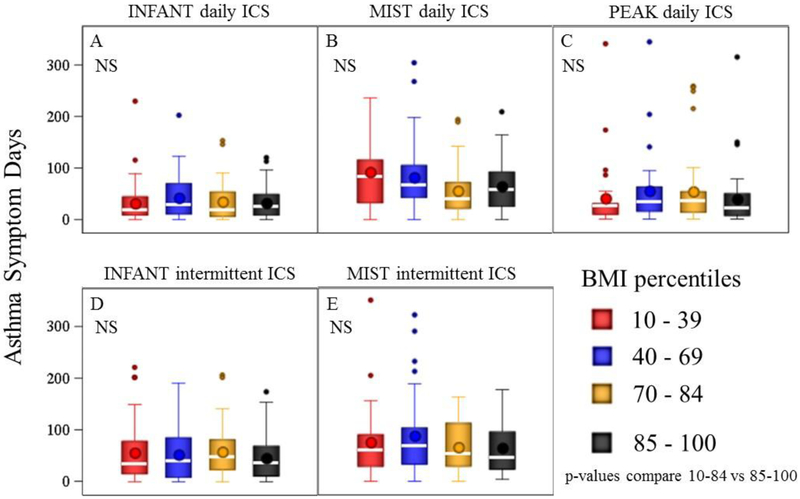
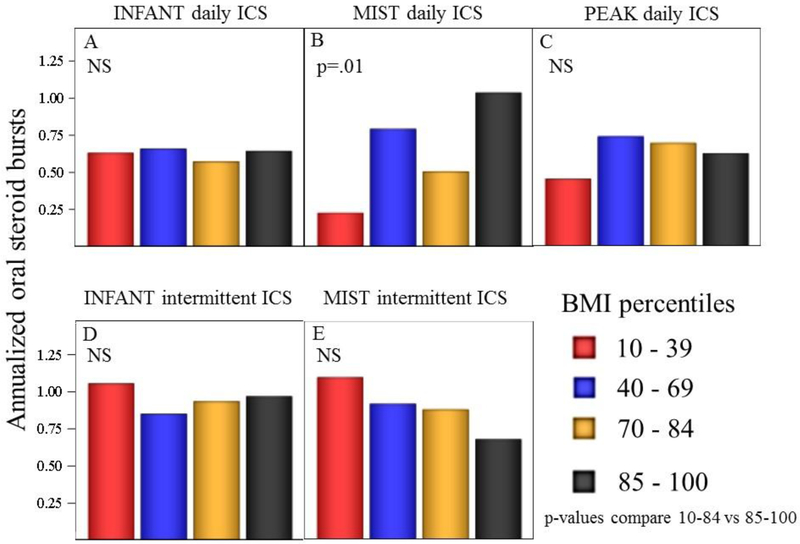
Methods: This post hoc study of 3 large multicenter trials involving 2- to 5-year-old children compared annualized asthma symptom days and exacerbations among normal weight (NW) (body mass index: 10th-84th percentiles) versus OW (body mass index: ≥85th percentile) participants. Participants had been randomized to daily ICS, intermittent ICS, or daily placebo. Simple and multivariable linear regression was used to compare body mass index groups.
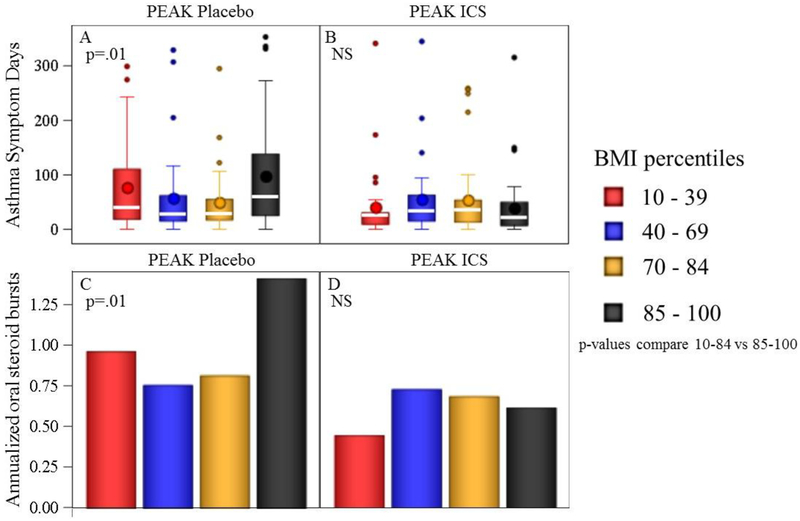
Results: Within the group not treated with a daily controller, OW children had more asthma symptom days (90.7 vs 53.2, P = .020) and exacerbations (1.4 vs 0.8, P = .009) thanNW children did. Within the ICS-treated groups, OW and NW children had similar asthma symptom days (daily ICS: 47.2 vs 44.0 days, P = .44; short-term ICS: 61.8 vs 52.9 days, P = .46; as-needed ICS: 53.3 vs 47.3 days, P = .53), and similar exacerbations (daily ICS: 0.6 vs 0.8, P = .10; short-term ICS: 1.1 vs 0.8 days, P = .25; as-needed ICS: 1.0 vs 1.1, P = .72). Compared with placebo, daily ICS in OW led to fewer annualized asthma symptom days (90.7 vs 41.2, P = .004) and exacerbations (1.4 vs 0.6, P = .006), while similar protective ICS effects were less apparent among NW.
Conclusions: In preschool children off controller therapy, OW is associated with greater asthma impairment and exacerbations. However, unlike older asthmatic patients, OW preschool children do not demonstrate reduced responsiveness to ICS therapy.
Keywords: Asthma; children; exacerbation; infants; obesity; overweight.
Copyright © 2017 American Academy of Allergy, Asthma & Immunology. Published by Elsevier Inc. All rights reserved.
Figures
Similar articles
-
Intermittent versus daily inhaled corticosteroids for persistent asthma in children and adults.Cochrane Database Syst Rev. 2012 Dec 12;12:CD009611. doi: 10.1002/14651858.CD009611.pub2. Cochrane Database Syst Rev. 2012. Update in: Cochrane Database Syst Rev. 2013 Feb 28;(2):CD009611. doi: 10.1002/14651858.CD009611.pub3. PMID: 23235678 Updated. Review.
-
Daily vs. intermittent inhaled corticosteroids for recurrent wheezing and mild persistent asthma: a systematic review with meta-analysis.Respir Med. 2013 Aug;107(8):1133-40. doi: 10.1016/j.rmed.2013.05.005. Epub 2013 Jun 14. Respir Med. 2013. PMID: 23769720 Review.
-
Long-acting muscarinic antagonists (LAMA) added to inhaled corticosteroids (ICS) versus the same dose of ICS alone for adults with asthma.Cochrane Database Syst Rev. 2015 Aug 24;2015(8):CD011397. doi: 10.1002/14651858.CD011397.pub2. Cochrane Database Syst Rev. 2015. PMID: 26301488 Free PMC article. Review.
-
Combination of inhaled long-acting beta2-agonists and inhaled steroids versus higher dose of inhaled steroids in children and adults with persistent asthma.Cochrane Database Syst Rev. 2005 Oct 19;(4):CD005533. doi: 10.1002/14651858.CD005533. Cochrane Database Syst Rev. 2005. Update in: Cochrane Database Syst Rev. 2010 Apr 14;(4):CD005533. doi: 10.1002/14651858.CD005533.pub2. PMID: 16235409 Updated. Review.
-
Increased versus stable doses of inhaled corticosteroids for exacerbations of chronic asthma in adults and children.Cochrane Database Syst Rev. 2010 Dec 8;(12):CD007524. doi: 10.1002/14651858.CD007524.pub3. Cochrane Database Syst Rev. 2010. Update in: Cochrane Database Syst Rev. 2016 Jun 07;(6):CD007524. doi: 10.1002/14651858.CD007524.pub4. PMID: 21154378 Updated. Review.
Cited by
-
Obesity-related asthma and its relationship with microbiota.Front Cell Infect Microbiol. 2024 Jan 15;13:1303899. doi: 10.3389/fcimb.2023.1303899. eCollection 2023. Front Cell Infect Microbiol. 2024. PMID: 38292857 Free PMC article. Review.
-
Prevention and Management of Childhood Obesity and Its Psychological and Health Comorbidities.Annu Rev Clin Psychol. 2020 May 7;16:351-378. doi: 10.1146/annurev-clinpsy-100219-060201. Epub 2020 Feb 25. Annu Rev Clin Psychol. 2020. PMID: 32097572 Free PMC article. Review.
-
Fish Oil Supplementation in Overweight/Obese Patients with Uncontrolled Asthma. A Randomized Trial.Ann Am Thorac Soc. 2019 May;16(5):554-562. doi: 10.1513/AnnalsATS.201807-446OC. Ann Am Thorac Soc. 2019. PMID: 30678465 Free PMC article. Clinical Trial.
References
-
- Akinbami LJ, Moorman JE, Bailey C, Zahran HS, King M, Johnson CA, et al. Trends in asthma prevalence, health care use, and mortality in the United States, 2001–2010. NCHS data brief. 2012(94):1–8. - PubMed
-
- Moorman JE, Akinbami LJ, Bailey CM, Zahran HS, King ME, Johnson CA, et al. National surveillance of asthma: United States, 2001–2010. Vital & health statistics Series 3, Analytical and epidemiological studies / [US Dept 2012(35):1–67. - PubMed
-
- NAEPP. Expert Panel Report 3: Guidelines for the Diagnosis and Management of Asthma (Full Report 2007). NHLBI/NIH, US Department of Health and Human Services; 2007. August 28, 2007. Contract No.: NIH Publication No. 07–4051.
-
- Michelson PH, Williams LW, Benjamin DK, Barnato AE. Obesity, inflammation, and asthma severity in childhood: data from the National Health and Nutrition Examination Survey 2001–2004. Ann Allergy Asthma Immunol. 2009;103(5):381–5. - PubMed
-
- Luder E, Melnik TA, DiMaio M. Association of being overweight with greater asthma symptoms in inner city black and Hispanic children. J Pediatr. 1998;132(4):699–703. - PubMed
Publication types
MeSH terms
Substances
Grants and funding
LinkOut - more resources
Full Text Sources
Other Literature Sources
Medical
