. 2018 Mar;208(3):1037-1055.
doi: 10.1534/genetics.117.300554. Epub 2017 Dec 20.

A Novel Sterol-Signaling Pathway Governs Azole Antifungal Drug Resistance and Hypoxic Gene Repression in Saccharomyces cerevisiae

Affiliations

A Novel Sterol-Signaling Pathway Governs Azole Antifungal Drug Resistance and Hypoxic Gene Repression in Saccharomyces cerevisiae

Nina D Serratore et al. Genetics. 2018 Mar.

Abstract

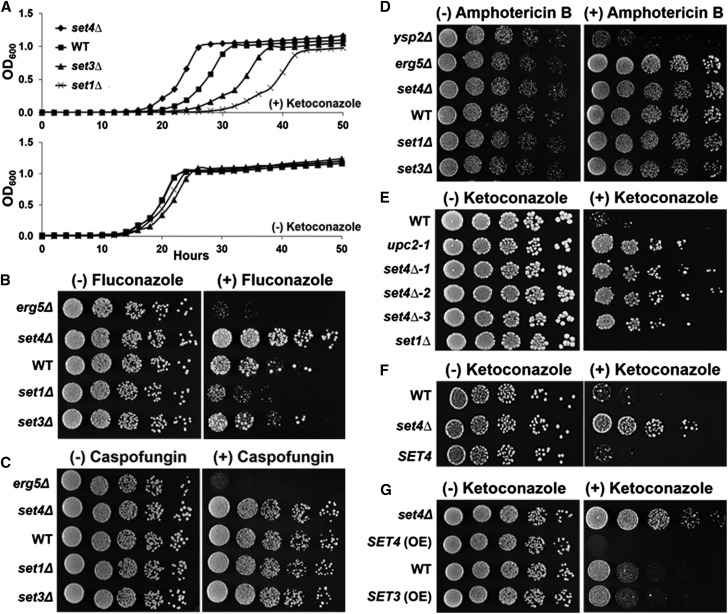
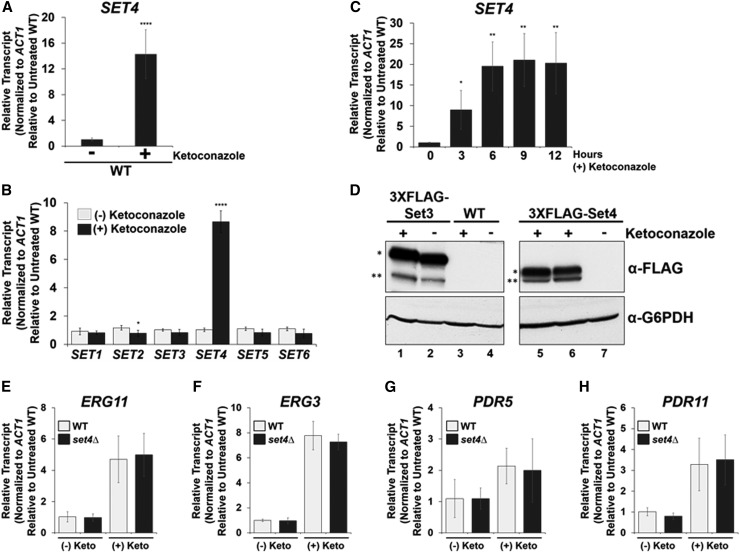
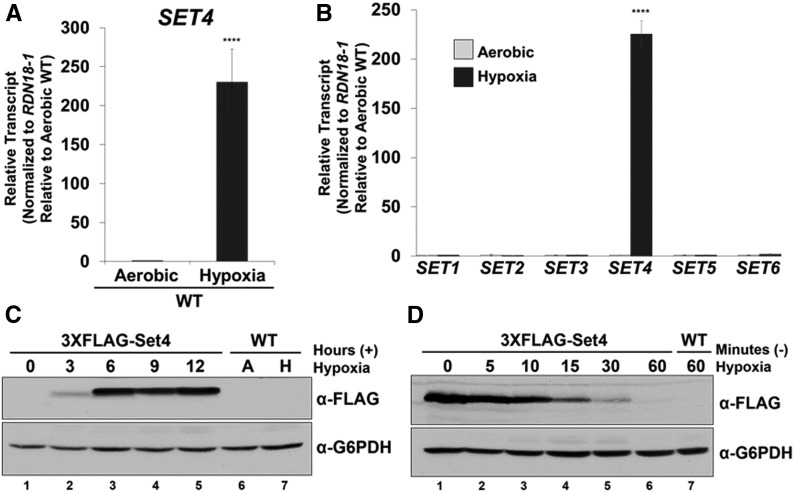
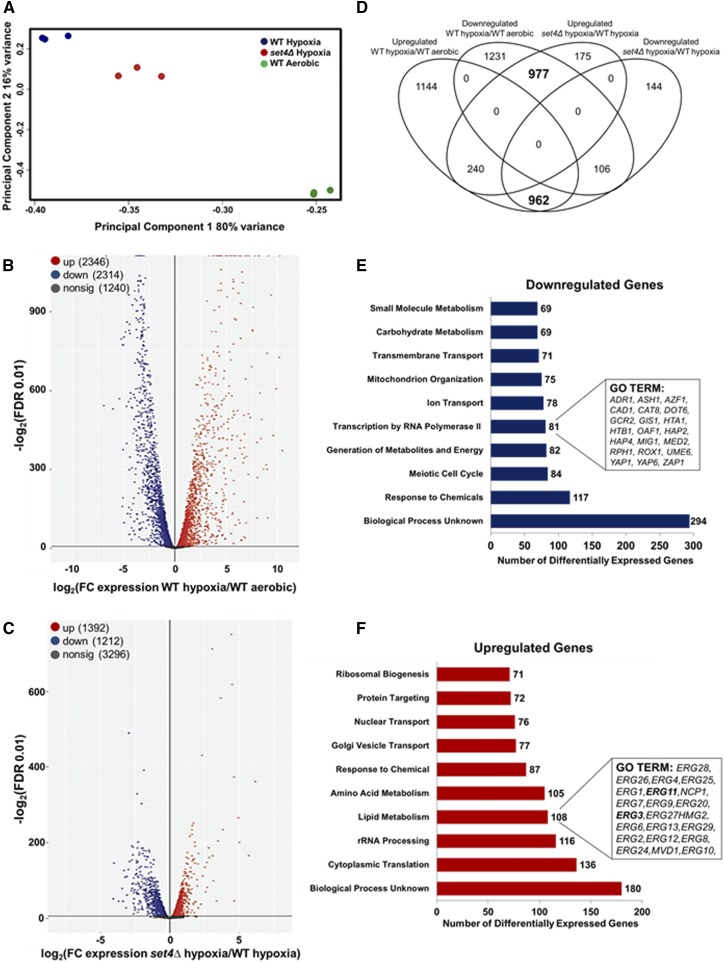
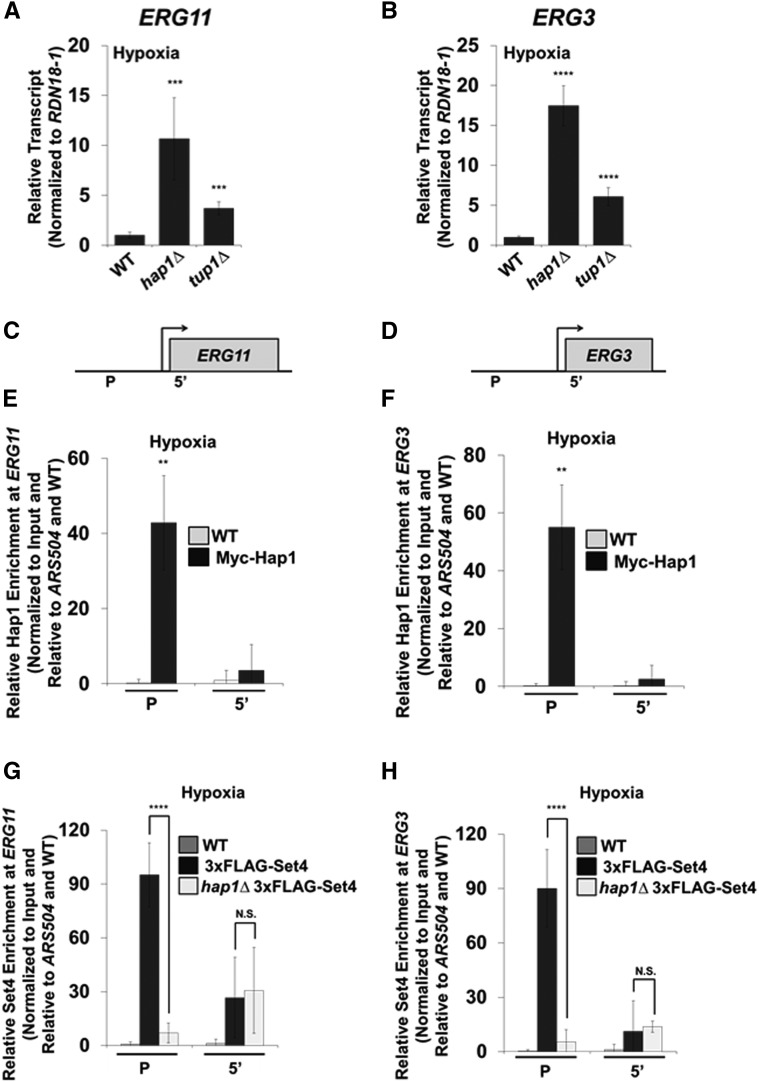
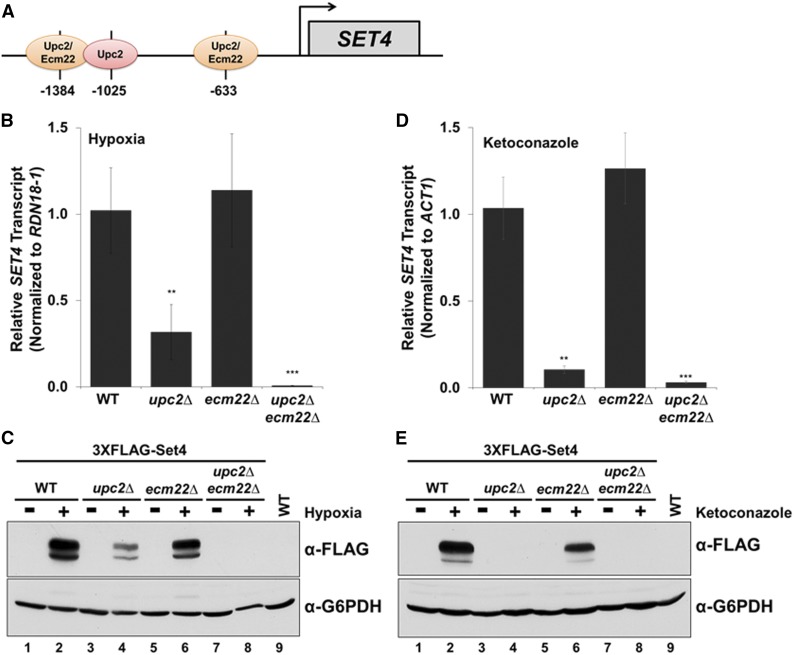
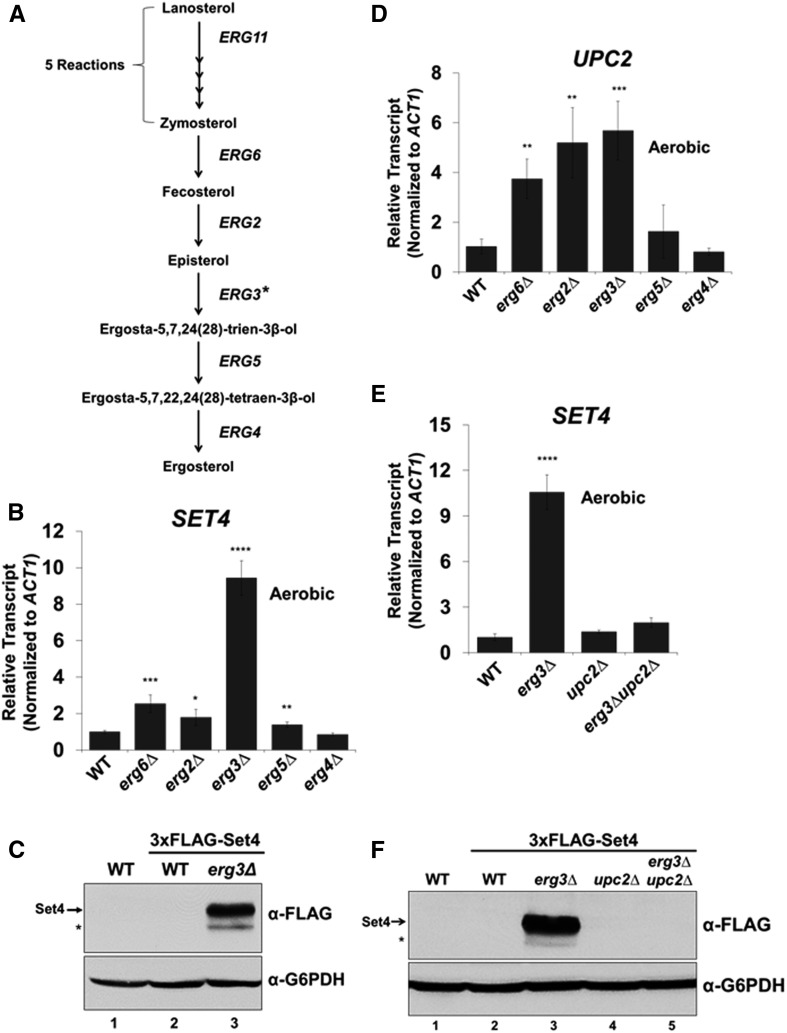
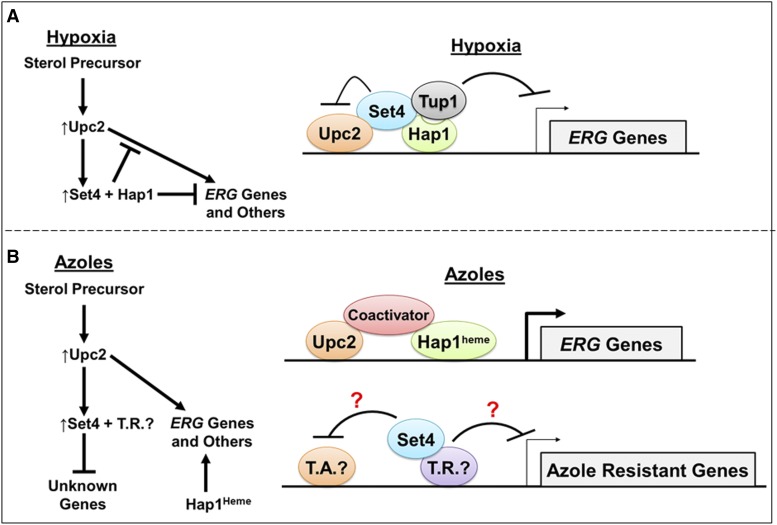
During antifungal drug treatment and hypoxia, genetic and epigenetic changes occur to maintain sterol homeostasis and cellular function. In this study, we show that SET domain-containing epigenetic factors govern drug efficacy to the medically relevant azole class of antifungal drugs. Upon this discovery, we determined that Set4 is induced when Saccharomyces cerevisiae are treated with azole drugs or grown under hypoxic conditions; two conditions that deplete cellular ergosterol and increase sterol precursors. Interestingly, Set4 induction is controlled by the sterol-sensing transcription factors, Upc2 and Ecm22 To determine the role of Set4 on gene expression under hypoxic conditions, we performed RNA-sequencing analysis and showed that Set4 is required for global changes in gene expression. Specifically, loss of Set4 led to an upregulation of nearly all ergosterol genes, including ERG11 and ERG3, suggesting that Set4 functions in gene repression. Furthermore, mass spectrometry analysis revealed that Set4 interacts with the hypoxic-specific transcriptional repressor, Hap1, where this interaction is necessary for Set4 recruitment to ergosterol gene promoters under hypoxia. Finally, an erg3Δ strain, which produces precursor sterols but lacks ergosterol, expresses Set4 under untreated aerobic conditions. Together, our data suggest that sterol precursors are needed for Set4 induction through an Upc2-mediated mechanism. Overall, this new sterol-signaling pathway governs azole antifungal drug resistance and mediates repression of sterol genes under hypoxic conditions.

Keywords: SET4; Saccharomyces cerevisiae; antifungal drugs; chromatin; epigenetics; gene expression; hypoxia; sterol.


Figures

Figure 1
Figure 1
SET domain proteins govern azole antifungal drug sensitivity and resistance. (A) Growth curve of indicated BY4741 strains over a 50-hr time course in SC media with 20 µg/ml ketoconazole or SC media. (B–E) Dilution assays of the indicated BY4741 strains spotted on SC plates containing 12 µg/ml fluconazole, 0.5 µg/ml caspofungin, 0.5 µg/ml amphotericin B, or 1 µg/ml ketoconazole. (F) Dilution assay of BY4741 WT or set4Δ strains transformed with plasmids containing SET4 from its endogenous promoter or empty vector spotted on SC-Ura plates with 1 µg/ml ketoconazole. (G) Dilution assay of BY4741 WT, set4Δ, and overexpressed SET4 and SET3 strains. Strains were spotted on SC plates with 1 µg/ml ketoconazole.
Figure 2
Figure 2
Azole antifungal drug treatment induces Set4 expression. (A and B) Expression of indicated genes was determined in WT cells treated with DMSO or 56 µg/ml ketoconazole for 3 hr by qRT-PCR analysis. Statistical analysis identified significant changes for SET2 and SET4 expression (* P < 0.05 and **** P < 0.0001, respectively). (C) SET4 expression was determined in WT cells treated with DMSO or 56 µg/ml ketoconazole by qRT-PCR analysis. Gene expression analysis was set relative to the DMSO-treated WT and expression was normalized to actin mRNA levels (ACT1). Data were analyzed from three biological replicates with three technical replicates. Error bars represent SD. * P < 0.05, ** P < 0.01. (D) Western blot analysis of Set3 and Set4 protein levels under DMSO and 56 µg/ml ketoconazole treatment. Lane 6 represents 3 hr of ketoconazole treatment. Lanes 1, 3, and 5 represent 6 hr of ketoconazole treatment. Lanes 2, 4, and 7 show untreated Set3, untagged WT, and Set4, respectively. G6PDH was used as a loading control. * indicates 3×FLAG-Set3 and 3×FLAG-Set4 protein levels, respectively. ** denotes protein degradation bands. (E–H) Gene expression analysis (qRT-PCR) of the indicated genes in WT and set4∆ strains treated with DMSO or 56 μg/ml ketoconazole for 6 hr. The indicated mRNA transcript levels were normalized to ACT1 and set relative to the DMSO-treated WT [indicated as (-) Keto]. Error bars represent the SD of three biological replicates each with three technical repeats. Gene expression and Western blot analyses were performed using the BY4741 strain.
Figure 3
Figure 3
Hypoxia induces Set4 expression. (A and B) SET4 transcript level was determined in WT cells grown under aerobic conditions or 8 hr of hypoxia by qRT-PCR analysis. **** P < 0.0001. (B) Expression of SET1–SET6 was determined in WT cells grown under aerobic conditions or 8 hr of hypoxia by qRT-PCR analysis. Gene expression analyses were set relative to the aerobic WT using the 18S rRNA (RDN18-1) as the internal control to normalize transcript levels. Data were analyzed from three biological replicates with three technical replicates. Error bars represent SD. SET4 was the only gene that significantly changed in expression (**** P < 0.0001). (C) Western blot analysis of Set4 protein induction over time under hypoxia. Aerobic (A) and hypoxia (H). The untagged WT was used as a negative control. (D) Western blot analysis of Set4 protein levels following release from hypoxic conditions. Lane 1 represents Set4 protein levels following 8 hr of hypoxia. Lanes 2–7 indicate Set4 protein levels following release from hypoxic conditions. G6PDH was used as a loading control. Gene expression and Western blot analyses were performed in BY4741 strains.
Figure 4
Figure 4
Set4 alters global levels of gene expression under hypoxic conditions. The genome-wide changes in gene expression under hypoxia were performed using BY4741 WT and set4Δ strains. (A) The PCA for WT and set4Δ hypoxic samples relative to WT aerobic samples based on the counts per million. (B) Volcano plot showing the significance [−log2 (FDR), y-axis] vs. the fold change (x-axis) of the DEGs identified in the WT hypoxic samples relative to WT aerobic samples. (C) Volcano plot showing the significance [−log2 (FDR), y-axis] vs. the fold change (x-axis) of the DEGs identified in the set4Δ hypoxic samples relative to WT hypoxic samples. Genes with significant differential expression (FDR < 0.01) in (B and C) are highlighted in red or blue for up- and downregulated genes, respectively. Gray highlighted genes are considered nonsignificant. (D) Venn diagram showing the number of genes identified as differentially expressed (FDR < 0.01). Bold numbers indicate a high overlap of genes predicted to be in common by chance based on Fisher’s exact test (P < 10−52). (E and F) GO terms of the Set4-dependent DEGs under hypoxic conditions. Downregulated genes refer to the DEGs that are dependent on Set4 for activation and the upregulated genes refer to the DEGs that are dependent on Set4 for repression. Significantly enriched groups of GO terms were identified for the DEGs from set4Δ and WT hypoxic samples. Bar plots show the number of DEGs in each GO group that are dependent on Set4 under hypoxia. The number of genes in each GO group is shown to the right of each bar. Genes identified are shown in the inset boxes.
Figure 5
Figure 5
Set4 represses ergosterol genes and directly targets the promoters of ERG11 and ERG3 under hypoxia. (A and B) The mRNA transcript levels of ERG11 and ERG3 were determined in WT cells grown under aerobic or hypoxic conditions over time. qRT-PCR expression analysis in the WT strain was set relative to the aerobic or hypoxic WT using the 18S ribosome rRNA (RDN18-1) as the internal control to normalize transcript levels. (C and D) qRT-PCR analysis of ERG11 and ERG3 expression in set4Δ cells grown under aerobic or hypoxic conditions for 3, 6, or 9 hr. ERG11 and ERG3 expression in the set4∆ strain were normalized to RDN18-1 and set to the WT strain at the same relative time point. Data were analyzed from three biological replicates that had three technical replicates each. Error bars represent SD. * P < 0.05, ** P < 0.01, *** P < 0.005. (E and F) Gene expression analysis (qRT-PCR) of ERG11 and ERG3 under hypoxic conditions in WT, set4Δ, upc2Δ, and set4Δupc2Δ. The mRNA transcript levels were normalized to RDN18-1 and set relative to WT grown under hypoxia. * P < 0.05, *** P < 0.005. (G and H) Schematics of ERG11 and ERG3 loci with the specified positions of ChIP probes. (I and J) ChIP analysis of Set4 enriched at ERG11 and ERG3 was performed under hypoxic conditions using antibodies specific to a 3×FLAG tag for the detection of Set4. ChIP analyses were normalized to DNA input samples and set relative to the ARS504 and untagged WT. Error bars represent SD for three biological replicates with three technical replicates each. * P < 0.05, ** P < 0.01, **** P < 0.0001. Gene expression and ChIP analyses were performed using the FY2609 strain.
Figure 6
Figure 6
The transcriptional repressor, Hap1, is required for Set4 binding to the promoters of ergosterol genes under hypoxic conditions. (A and B) Relative transcript levels of ERG11 and ERG3 were determined following 8 hr of hypoxia in WT, hap1Δ, and tup1Δ strains using qRT-PCR analysis. Transcript levels were set relative to the WT strain and expression levels were normalized to RDN18-1. *** P < 0.005, **** P < 0.0001. (C and D) Schematics of ERG11 and ERG3 loci with the specified positions of ChIP probes. (E and F) ChIP analysis of Hap1 under hypoxia at ERG11 and ERG3. ** P < 0.005. (G and H) ChIP analysis of Set4 under hypoxia in WT and hap1Δ strains at ERG11 and ERG3. ChIP analyses were normalized to DNA input samples and set relative to the untagged WT and the ARS504 loci. Error bars represent SD for three biological replicates with three technical replicates each. Gene expression and ChIP analyses were performed using the FY2609 strain. **** P < 0.0001. N.S., no significant difference.
Figure 7
Figure 7
Set4 expression under hypoxia or azole drug-treated conditions is primarily dependent on Upc2. (A) Schematic of the Upc2 and Ecm22 binding sites located in the SET4 promoter. (B and D) Using the indicated strains, SET4 expression was determined by qRT-PCR analysis. SET4 expression levels were normalized to RDN18-1 (hypoxia) or ACT1 (ketoconazole) and set relative to the aerobic or DMSO-treated WT strain. Data were analyzed from three biological replicates with three technical repeats. Each error bar represents SD. ** P < 0.01 and *** P < 0.005. (C and E) Western blot analysis of Set4 levels under the indicated conditions. G6PDH was used as a loading control. Gene expression and Western blot analyses were performed using the BY4741 strain.
Figure 8
Figure 8
Set4 is constitutively expressed in an erg3Δ strain under aerobic conditions by a precursor sterol and Upc2. (A) Modified pathway showing the final steps in ergosterol biosynthesis. The * on ERG3 represents potential pathways that modify episterol to generate additional sterol precursors (see Figure S5 in File S5). (B) qRT-PCR analysis of SET4 transcript levels in ergosterol mutant strains under aerobic conditions. Transcript levels were normalized to ACT1 and set relative to WT. (C) Western blot analysis of 3×FLAG-Set4 levels in WT and erg3∆ strain under aerobic conditions. The * indicates a likely protein degradation band. (D) Gene expression analysis by qRT-PCR of UPC2 in indicated strains under aerobic conditions. (E) SET4 mRNA levels determined by qRT-PCR in WT, erg3∆, upc2∆, and erg3∆upc2∆ under aerobic conditions. (B, D, E) * P < 0.05, ** P < 0.005, *** P < 0.0005, **** P < 0.0001. (F) Western blot analysis of Set4 protein levels in strains from E under aerobic conditions. G6PDH was used as a loading control and an untagged WT was used a negative control. The band under the Set4 band likely indicates protein degradation and is indicated by *. Gene expression data were normalized to ACT1 and set relative to WT. Error bars represents SD of three biological replicates. Gene expression and Western blot analyses were performed using the BY4741 strain.
Figure 9
Figure 9
Sterol precursor(s) lead to Upc2-facilitated induction of Set4 to repress genes required for antifungal drug resistance and sterol homeostasis under hypoxic conditions. (A) Model under hypoxia: Sterol-facilitated induction of Set4 by Upc2 mediates repression of ERG genes by association with the transcriptional repressors Hap1 and Tup1 to block the function of the transcriptional activator, Upc2. Hap1 under hypoxic conditions is heme independent and is considered a transcriptional repressor. Activation of ERG genes by Upc2 is blocked by the presence of Set4 and Hap1 as indicated by the inhibitory symbol. S288C strains expressing the hap1–Ty1 gene fusion partially repress ERG gene expression; whereas yeast strains expressing HAP1 will fully repress ERG genes. (B) Model under azole drug treatment: Sterol-facilitated induction of Set4 by Upc2 mediates repression of genes involved in azole resistance and likely associates with a transcriptional repressor (T.R.) to block a transcriptional activator (T.A.). Under azole treatment, ERG genes are Set4 independent but are activated by Upc2, Hap1heme, and coactivators. Hap1 under aerobic conditions is bound to heme and is considered a transcriptional activator.

Similar articles

Cited by

References

    1. Abramova N., Sertil O., Mehta S., Lowry C. V., 2001. Reciprocal regulation of anaerobic and aerobic cell wall mannoprotein gene expression in Saccharomyces cerevisiae. J. Bacteriol. 183: 2881–2887. - PMC - PubMed
    1. Agarwal A. K., Rogers P. D., Baerson S. R., Jacob M. R., Barker K. S., et al. , 2003. Genome-wide expression profiling of the response to polyene, pyrimidine, azole, and echinocandin antifungal agents in Saccharomyces cerevisiae. J. Biol. Chem. 278: 34998–35015. - PubMed
    1. Alimardani P., Regnacq M., Moreau-Vauzelle C., Ferreira T., Rossignol T., et al. , 2004. SUT1-promoted sterol uptake involves the ABC transporter Aus1 and the mannoprotein Dan1 whose synergistic action is sufficient for this process. Biochem. J. 381: 195–202. - PMC - PubMed
    1. Bard M., Lees N. D., Turi T., Craft D., Cofrin L., et al. , 1993. Sterol synthesis and viability of erg11 (cytochrome P450 lanosterol demethylase) mutations in Saccharomyces cerevisiae and Candida albicans. Lipids 28: 963–967. - PubMed
    1. Becerra M., Lombardia-Ferreira L. J., Hauser N. C., Hoheisel J. D., Tizon B., et al. , 2002. The yeast transcriptome in aerobic and hypoxic conditions: effects of hap1, rox1, rox3 and srb10 deletions. Mol. Microbiol. 43: 545–555. - PubMed

Publication types

MeSH terms