. 2017 Dec 5:8:2370.
doi: 10.3389/fmicb.2017.02370. eCollection 2017.

Inhibition of Tissue Matrix Metalloproteinases Interferes with Mycobacterium tuberculosis-Induced Granuloma Formation and Reduces Bacterial Load in a Human Lung Tissue Model

Affiliations

Inhibition of Tissue Matrix Metalloproteinases Interferes with Mycobacterium tuberculosis-Induced Granuloma Formation and Reduces Bacterial Load in a Human Lung Tissue Model

Venkata R Parasa et al. Front Microbiol. .

Abstract

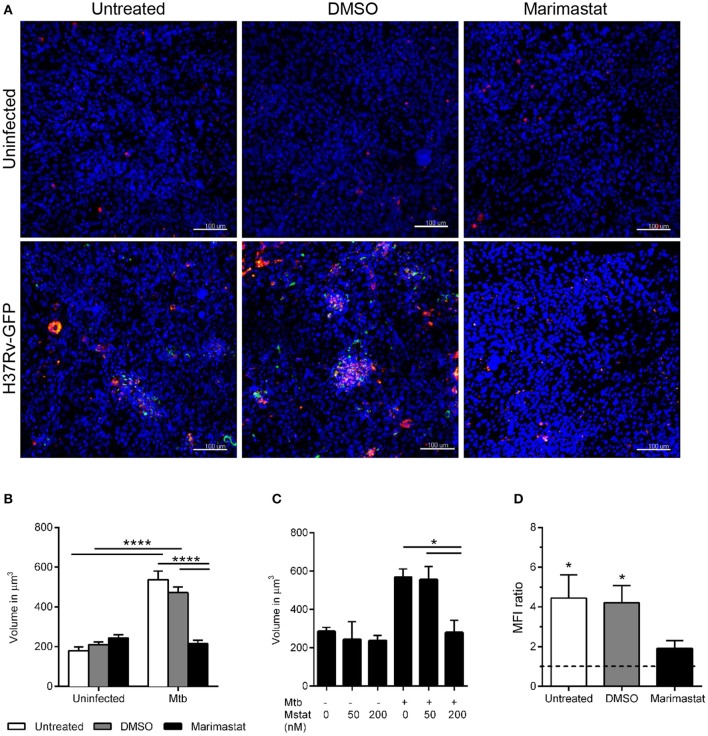
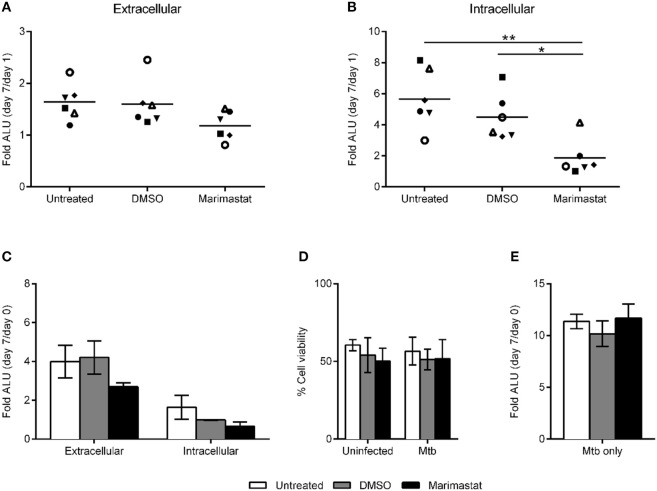
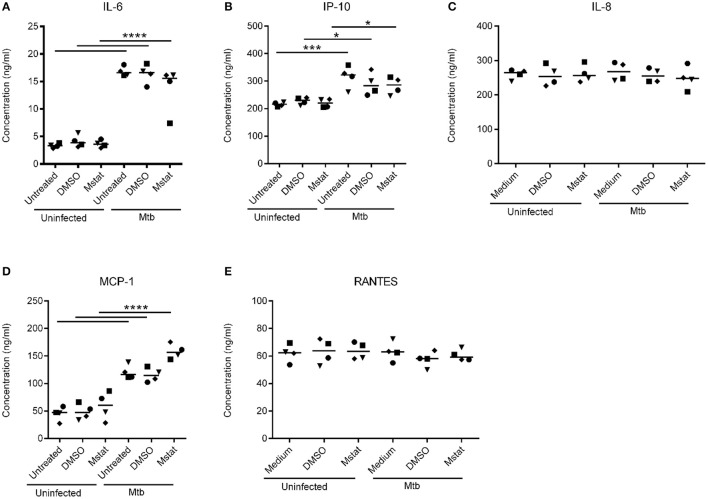
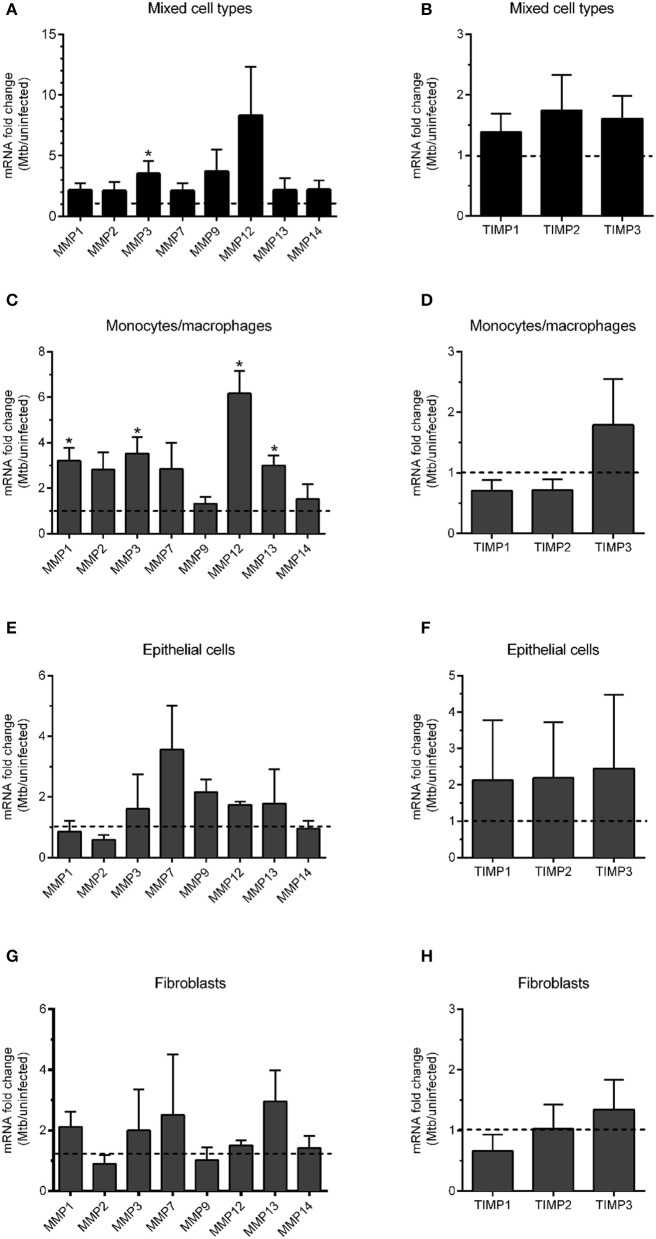
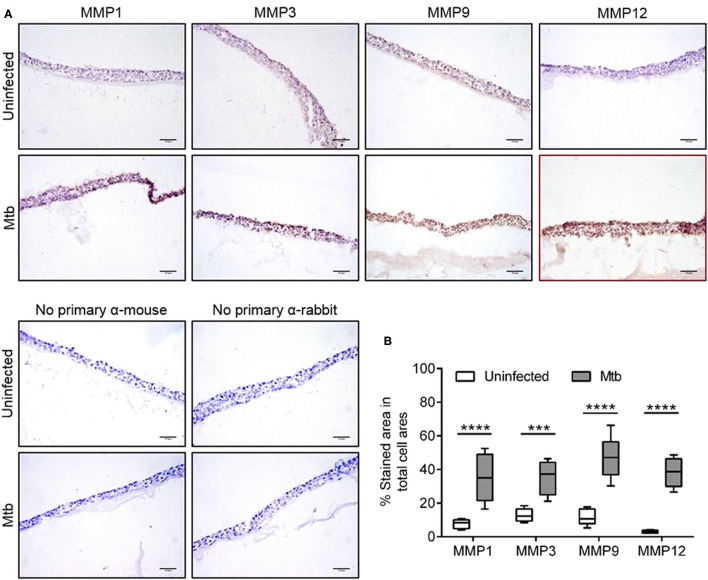
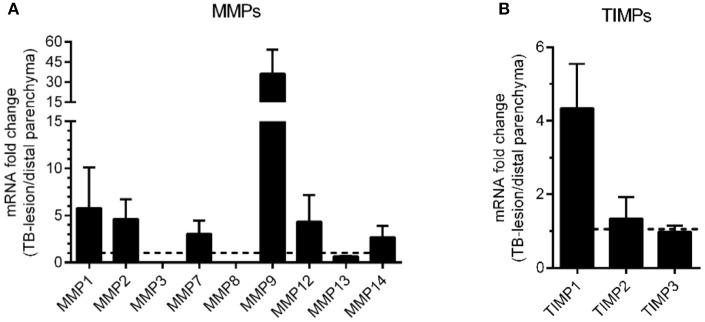
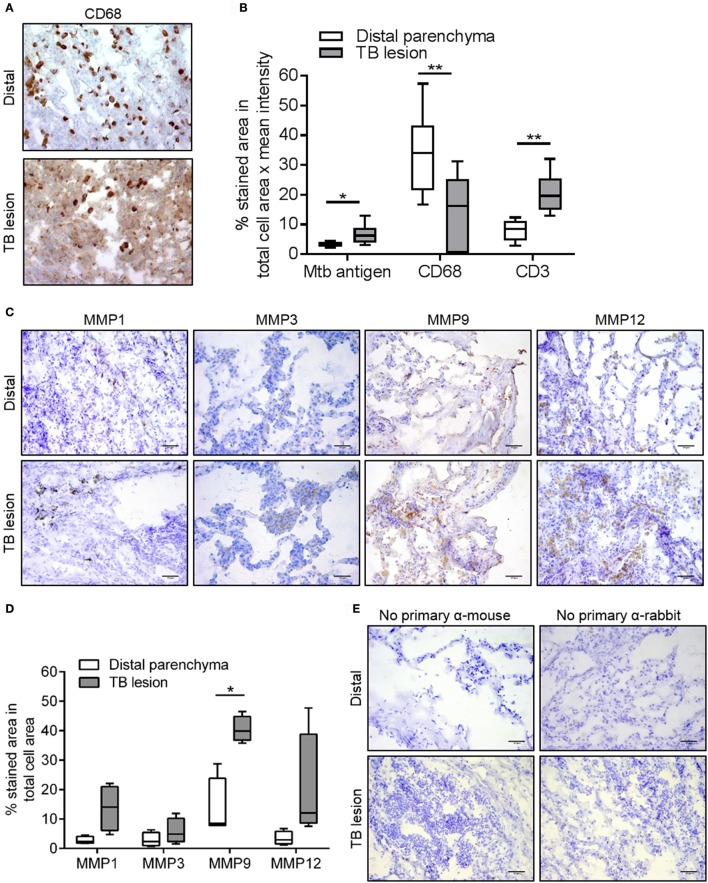
Granulomas are hallmarks of pulmonary tuberculosis (TB) and traditionally viewed as host-protective structures. However, recent evidence suggest that Mycobacterium tuberculosis (Mtb) uses its virulence factors to stimulate the formation of granuloma. In the present study, we investigated the contribution of matrix metalloproteinases (MMPs), host enzymes that cause degradation of the extracellular matrix, to granuloma formation and bacterial load in Mtb-infected tissue. To this end, we used our lung tissue model for TB, which is based on human lung-derived cells and primary human monocyte-derived macrophages. Global inhibition of MMPs in the Mtb-infected tissue model reduced both granuloma formation and bacterial load. The infection caused upregulation of a set of MMPs (MMP1, 3, 9, and 12), and this finding could be validated in lung biopsies from patients with non-cavitary TB. Data from this study indicate that MMP activation contributes to early TB granuloma formation, suggesting that host-directed, MMP-targeted intervention could be considered as adjunct therapy to TB treatment.

Keywords: granuloma; matrix metalloproteinases; tissue inhibitor of matrix metalloproteinases; tissue models; tuberculosis.


Figures

Figure 1
Figure 1
Effect of marimastat on early granuloma formation in Mtb-infected lung tissue models. (A) Tissue models (nuclei stained with DAPI, blue) were left untreated or incubated with DMSO or marimastat before implantation with PKH26-labeled monocytes (red) and macrophages, uninfected or infected with GFP-expressing (green) H37Rv. The tissues were fixed at day 7 and subjected to DAPI-staining followed by confocal microscopy. Images show merged confocal images of randomly selected fields (uninfected models) or bacteria-harboring fields selected in the green channel (H37Rv-GFP-infected models) with treatments as indicated. (B) Z-stacks were obtained in the red channel and the volume of the cells/clusters was determined in uninfected and infected samples with or without 200 nM marimastat (n = 13). (C) Two different concentrations of marimastat (Mstat), 50 and 200 nM were tested (n = 3). (D) Regions of interest (ROIs) with (ROIbact) and without bacteria (ROIcon) were selected in the green channel and the MFI in the red channel was determined. Recruitment of monocytes/macrophages to the site of infection is expressed as ratio of MFI (ROIbact)/MFI (ROIcon, n = 6). Data are expressed as means + SEM. Statistical analyses were carried out using 2-way ANOVA with Sidak's multiple comparisons test for comparisons within and between groups (B), 1-way ANOVA with Tukey's multiple comparisons test within the infected group (C) and Wilcoxon signed rank test to compare MFI ratio (D). Scale bars are 100 μm. *p ≤ 0.05, ****p ≤ 0.0001.
Figure 2
Figure 2
Effect of MMP inhibition on bacterial growth. Tissue models were left untreated, mock-treated (DMSO) or treated with 200 nM marimastat, infected with Mtb-lux, digested and analyzed with respect to bacterial replication after 1 and 7 days post infection. The fold change in bacterial numbers expressed as the ratio of arbitrary luminescence units (ALU) from day 7/Day 1 (n = 6) was determined in the extracellular matrix (A) and intracellularly (B). (C) Macrophage monocultures were treated as indicated and infected with Mtb-lux. ALU was determined in supernatants (extracellular) and in cell lysates (intracellular) at day 0 and 7 and the fold change in bacterial numbers was determined by calculating the ratios of ALU at day 7/day 0 (n = 3). (D) The viability of these macrophages was determined by measuring the uptake of calcein-AM. (E) Broth cultures of Mtb-lux were left untreated or incubated with DMSO or marimastat and the fold change in bacterial numbers expressed as the ratio of arbitrary luminescence units (ALU) from day 7/day 0. Statistical analysis was done using 1-way ANOVA with Tukey's multiple comparisons test between groups (A,B,E, *p ≤ 0.05, **p ≤ 0.01) and 2-way ANOVA with Sidak's multiple comparisons test within and between groups (C,D, error bars are SEM).
Figure 3
Figure 3
Cytokine and chemokine levels in Mtb-infected lung tissue models. Cytokine Bead Array analyses were performed to measure cytokine and chemokine levels in the medium supernatant of lung tissue models (both Mtb-infected and uninfected) that were treated with 200 nM marimastat (Mstat) or mock (untreated or DMSO). The concentrations of IL-6 (A), IP-10 (B), IL-8 (C), MCP-1 (D), and RANTES (E) are shown as means (lines) and individual symbols from four experiments. Statistical analyses were done using 2-way ANOVA with Sidak's multiple comparisons test. *p ≤ 0.05, ***p ≤ 0.001, ****p ≤ 0.0001.
Figure 4
Figure 4
mRNA transcript analysis of MMPs and TIMPs in Mtb-infected lung tissue models. mRNA expression of a panel of MMPs and TIMPs in Mtb-infected tissue models was analyzed (n = 3). mRNA was extracted either from the whole tissue model (“Mixed cell types”, A,B) or from individual cell types isolated from digested tissue (C,D macrophages; E,F epithelial cells and G,H fibroblasts). Data are presented as mean + SEM of fold change in mRNA expression normalized to uninfected tissue models (dotted line) (n = 6). Statistical analysis was done using Wilcoxon-Signed Rank test. *p ≤ 0.05.
Figure 5
Figure 5
Immunohistochemistry and in-situ quantification of MMPs in lung tissue models. (A) Representative images of cryosectioned lung tissue models stained for MMP1, 3, 9, and 12 using immunohistochemistry (MMP-positive areas in brown color and hematoxylin-stained cellular areas in blue color). (B) Quantitative analysis of MMP-positive areas was performed by measuring the percentage of brown colored-area/total blue-colored area. Data are collected from eight fields per tissue section and are presented as median of 6 experiments (lines) with interquartile range (boxes). Statistical comparison of MMP-positive area in uninfected and Mtb-infected tissue models was performed using 2-way ANOVA with Sidak's multiple comparison test. Scale bar is 50 μm. ***p ≤ 0.001, ****p ≤ 0.0001.
Figure 6
Figure 6
mRNA transcript analysis of biopsies from TB patients. Granulomatous TB lesion lung biopsies from infiltrative non-cavitary TB patients (n = 4) were analyzed for mRNA expression of MMPs (A) and TIMPs (B). The mRNA levels were normalized to data from lesion-free distal lung parenchyma of the same patients (dotted line) and are expressed as means with SEM.
Figure 7
Figure 7
Immunohistochemistry of MMP1, 3, 9, and 12 in lung biopsies from TB patients. (A) Representative images of cryosectioned TB lesions and distal areas of lung tissue biopsies obtained from patients with non-cavitary pulmonary TB and stained with anti-CD68 antibodies using immunohistochemistry (CD68-positive areas are in brown color and hematoxylin-stained areas are in blue color). (B) Quantitative analysis of the cryosections of the biopsies using a BCG-specific antibody with cross-reactivity to Mtb (Mtb antigen), anti-CD68 (macrophages) and anti-CD3 (T cells). (C) Representative images of the cryosectioned TB lesions and distal areas of lung tissue biopsies stained with anti-MMP1, 3, 9, and-12. (D) Quantitative analysis of the MMP-positive areas expressed as percentage of brown colored-area/total blue-colored area. Data was obtained from 4 patients (10 fields/tissue section) and are shown as median (lines) with interquartile range (boxes). (E) In a control experiment, cryosections of the biopsies were stained without using the primary antibodies. Statistical comparison of TB lesions and distal parenchyma was performed using Student's t-test for paired samples. Scale bar–50 μm. *p ≤ 0.05, **p ≤ 0.01.

Similar articles

Cited by

References

    1. Al Shammari B., Shiomi T., Tezera L., Bielecka M. K., Workman V., Sathyamoorthy T., et al. . (2015). The extracellular matrix regulates granuloma necrosis in tuberculosis. J. Infect. Dis. 212, 463–473. 10.1093/infdis/jiv076 - DOI - PMC - PubMed
    1. Andersson J., Samarina A., Fink J., Rahman S., Grundstrom S. (2007). Impaired expression of perforin and granulysin in CD8+ T cells at the site of infection in human chronic pulmonary tuberculosis. Infect. Immun. 75, 5210–5222. 10.1128/IAI.00624-07 - DOI - PMC - PubMed
    1. Braian C., Svensson M., Brighenti S., Lerm M., Parasa V. R. (2015). A 3D human lung tissue model for functional studies on Mycobacterium tuberculosis infection. J. Vis. Exp. 104:e53084. 10.3791/53084. - DOI - PMC - PubMed
    1. Cronan M. R., Beerman R. W., Rosenberg A. F., Saelens J. W., Johnson M. G., Oehlers S. H., et al. . (2016). Macrophage epithelial reprogramming underlies mycobacterial granuloma formation and promotes infection. Immunity 45, 861–876. 10.1016/j.immuni.2016.09.014 - DOI - PMC - PubMed
    1. Davis J. M., Ramakrishnan L. (2009). The role of the granuloma in expansion and dissemination of early tuberculous infection. Cell 136, 37–49. 10.1016/j.cell.2008.11.014 - DOI - PMC - PubMed