. 2018 Apr;11(4):215-226.
doi: 10.1158/1940-6207.CAPR-17-0296. Epub 2017 Dec 8.

Pioglitazone Inhibits Periprostatic White Adipose Tissue Inflammation in Obese Mice

Affiliations

Pioglitazone Inhibits Periprostatic White Adipose Tissue Inflammation in Obese Mice

Miki Miyazawa et al. Cancer Prev Res (Phila). 2018 Apr.

Abstract

Obesity is associated with an increased incidence of high-grade prostate cancer and poor prognosis for prostate cancer patients. Recently, we showed that obesity-related periprostatic white adipose tissue (WAT) inflammation, characterized by crown-like structures (CLS) consisting of dead or dying adipocytes surrounded by macrophages, was associated with high-grade prostate cancer. It is possible, therefore, that agents that suppress periprostatic WAT inflammation will alter the development or progression of prostate cancer. Pioglitazone, a ligand of PPARγ, is used to treat diabetes and possesses anti-inflammatory properties. Here, our main objectives were to determine whether pioglitazone inhibited obesity-related periprostatic WAT inflammation in mice and then to elucidate the underlying mechanism. Treatment with pioglitazone reduced the density of CLS in periprostatic fat and suppressed levels of TNFα, TGFβ, and the chemokine monocyte chemoattractant protein-1 (MCP-1). Importantly, the ability of pioglitazone to suppress periprostatic WAT inflammation was abrogated in MCP-1 knockout mice. Pioglitazone caused dose-dependent induction of both adiponectin, an anti-inflammatory adipokine, and its receptor AdipoR2 in cultured 3T3-L1 cells and in periprostatic WAT of obese mice. Pioglitazone blocked TNFα-mediated induction of MCP-1 in 3T3-L1 cells, an effect that was attenuated when either adiponectin or AdipoR2 were silenced. Taken together, pioglitazone-mediated induction of adiponectin suppressed the elevation in MCP-1 levels, thereby attenuating obesity-related periprostatic WAT inflammation. These findings strengthen the rationale for future efforts to determine whether targeting the PPARγ-adiponectin-MCP-1 axis will decrease periprostatic adipose inflammation and thereby reduce the risk of high-grade prostate cancer or improve outcomes for men with prostate cancer. Cancer Prev Res; 11(4); 215-26. ©2017 AACR.


Conflict of interest statement

Disclosures: None of the authors disclosed potential conflicts of interest.

Figures

Figure 1
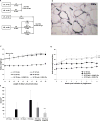
Figure 1. Pioglitazone inhibits high fat diet induced periprostatic white adipose inflammation
A, study schema. C57BL/6J male mice were treated with low fat (LF) or high fat (HF) diets beginning at 6 weeks of age. After 12 weeks of feeding, two groups of mice fed either LF or HF diets were sacrificed. Two additional groups continued to receive LF diet or HF diet for an additional 8 weeks prior to sacrifice. Other mice received the HF diet for 12 weeks before being switched to HF diet containing either 0.006% or 0.06% w/w pioglitazone for an additional 8 weeks until sacrifice at 26 weeks of age. B, hematoxylin and eosin-stained section showing several CLS (arrows) in periprostatic fat. C, body weights of mice in different treatment groups. D, caloric consumption was monitored weekly. E, periprostatic white adipose inflammation defined as CLS/cm2 was quantified at the time of sacrifice. Mean ± SD (error bars) are shown. D, n=9–10/group. E, n=4–10/group; ***p<0.001 compared with HF diet 20 weeks.
Figure 2
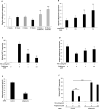
Figure 2. Pioglitazone suppresses levels of proinflammatory mediators in periprostatic white adipose tissue in mice fed a high fat diet
At 6 weeks of age, C57BL/6J male mice were fed either low fat (LF) diet or high fat (HF) diet. The LF diet fed mice were randomized to one of two groups. One group was sacrificed at 18 weeks of age after 12 weeks on LF diet while the second group was sacrificed at 26 weeks of age after 20 weeks on LF diet. The other mice were fed HF diet for 12 weeks to induce obesity and then randomized to one of four groups. One group was sacrificed at 18 weeks of age after 12 weeks on HF diet. The second group was continued on HF diet, the third group was switched to HF diet containing 0.006% w/w pioglitazone and the fourth group was switched to HF diet containing 0.06% w/w pioglitazone for an additional 8 weeks until sacrifice at 26 weeks of age. A, average adipocyte diameter. B–E, Real-time PCR was carried out for CD68, MCP-1, TNF-α and TGF-β. Mean ± SD (error bars) are shown. A, n=4–10/group; **p<0.01 compared with LF diet 20 weeks and ***p<0.001 compared with LF diet 12 weeks. B–E, n=3–7/group; **p<0.01 compared with HF diet 20 weeks.
Figure 3
Figure 3. Treatment with pioglitazone led to time-dependent suppression of periprostatic white adipose tissue inflammation
A, study schema. At 6 weeks of age, C57BL/6J male mice were fed either a low fat (LF) or high fat (HF) diet. A group of LF diet fed mice was sacrificed at 18 weeks of age after 12 weeks on LF diet. A second group of LF diet fed mice was sacrificed at 20 weeks of age after 14 weeks on LF diet. A third group of LF diet fed mice was sacrificed at 22 weeks of age after 16 weeks on LF diet. The fourth group of LF diet fed mice was sacrificed at 27 weeks of age after 21 weeks on LF diet. The HF diet fed mice were randomized to seven groups at 18 weeks of age after 12 weeks on HF diet. One group was sacrificed at 18 weeks of age while three other groups were continued on HF diet for an additional 2, 4 or 9 weeks. The remaining three groups were switched to HF diet containing 0.06% w/w pioglitazone for an additional 2, 4 or 9 weeks. B, body weights of mice in different treatment groups. C, caloric consumption was monitored in mice following initiation of pioglitazone treatment. Average calorie consumption during the treatment period is presented. D, periprostatic white adipose inflammation was quantified as CLS/cm2. B–D, mean ± SD (error bars) are shown. B, n=6–16/group, ***p<0.001 compared with LF diet group. C, n=6–16/group; **p<0.01 compared with HF diet group. D, n=6–12/group; **p<0.01, ***p<0.001 compared with HF diet group.
Figure 4
Figure 4. The anti-inflammatory effects of pioglitazone are mediated by MCP-1
A, study schema. Beginning at 6 weeks of age, wild-type and MCP-1 −/− (B6.129S4-Ccl2tm1Rol/J) mice were fed either low fat (LF) or high fat (HF) diets for 20 weeks. Other mice received 12 weeks of HF diet before being switched to HF diet containing 0.06% w/w pioglitazone for 8 weeks. All mice were sacrificed at 26 weeks of age. B, body weight was monitored weekly in different treatment groups. C, periprostatic white adipose inflammation was quantified as CLS/cm2. Mean ± SD (error bars) are shown; n=4–6/group; *p<0.05 compared with HF diet group.
Figure 5
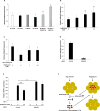
Figure 5. Pioglitazone-mediated induction of adiponectin regulates MCP-1 levels
A, At 6 weeks of age, C57BL/6J male mice were fed either low fat (LF) diet or high fat (HF) diet. The LF diet fed mice were randomized to one of two groups. One group was sacrificed at 18 weeks of age after 12 weeks on LF diet while the second group was sacrificed at 26 weeks of age after 20 weeks on LF diet. The other mice were fed HF diet for 12 weeks to induce obesity and then randomized to one of four groups. One group was sacrificed at 18 weeks of age after 12 weeks on HF diet. The second group was continued on HF diet, the third group was switched to HF diet containing 0.006% w/w pioglitazone and the fourth group was switched to HF diet containing 0.06% w/w pioglitazone for an additional 8 weeks until sacrifice at 26 weeks of age. Adiponectin mRNA levels were measured in periprostatic white adipose tissue. B, 3T3-L1 adipocytes were treated with 0–2.5 µM pioglitazone for 6 hours. Relative adiponectin expression was quantified. C and D, 3T3-L1 adipocytes were pretreated with 0–2.5 µM pioglitazone for 6 hours. Subsequently, cells were treated with TNF-α for an additional 6 hours. MCP-1 (C) and adiponectin (D) mRNA levels were quantified. E, 3T3-L1 adipocytes were transfected with control or adiponectin siRNA. Levels of adiponectin in the medium were quantified by ELISA. F, 3T3-L1 adipocytes were transfected with control siRNA or adiponectin siRNA. Seventy-two hours after transfection, cells were treated with vehicle or pioglitazone for 6 hours. Subsequently, cells received TNF-α (10 ng/mL) for an additional 6 hours. Levels of MCP-1 mRNA were quantified. Mean ± SD (error bars) are shown. A, n=3–7/group; **p<0.01, ***p<0.001 compared to mice fed HF diet for 20 weeks. B–F, n=4–6/treatment group; *p<0.05, **p<0.01, ***p<0.001.
Figure 6
Figure 6. Pioglitazone induces AdipoR2
A, At 6 weeks of age, C57BL/6J male mice were fed either low fat (LF) diet or high fat (HF) diet. The LF diet fed mice were randomized to one of two groups. One group was sacrificed at 18 weeks of age after 12 weeks on LF diet while the second group was sacrificed at 26 weeks of age after 20 weeks on LF diet. The other mice were fed HF diet for 12 weeks to induce obesity and then randomized to one of four groups. One group was sacrificed at 18 weeks of age after 12 weeks on HF diet. The second group was continued on HF diet, the third group was switched to HF diet containing 0.006% w/w pioglitazone and the fourth group was switched to HF diet containing 0.06% w/w pioglitazone for an additional 8 weeks until sacrifice at 26 weeks of age. AdipoR2 mRNA levels were quantified in periprostatic white adipose tissue. B, 3T3-L1 adipocytes were treated with 0–2.5 µM pioglitazone for 6 hours. Relative AdipoR2 expression was quantified. C, 3T3-L1 adipocytes were pretreated with 0–2.5 µM pioglitazone for 6 hours. Subsequently, cells were treated with TNF-α for an additional 6 hours. Relative AdipoR2 expression was quantified. D, 3T3-L1 adipocytes were transfected with control or AdipoR2 siRNA and levels of AdipoR2 were quantified. E, 3T3-L1 adipocytes were transfected with control siRNA or AdipoR2 siRNA. Seventy-two hours after transfection, cells were treated with vehicle or pioglitazone for 6 hours. Subsequently, cells received TNF-α (10 ng/mL) for an additional 6 hours. Levels of MCP-1 mRNA were quantified. For A–E, mean ± SD (error bars) are shown. A, n=3–7/group; *p<0.05, **p<0.01 compared to mice fed with LF diet for 20 weeks. B–E, n=4–6/group; *p<0.05, **p<0.01, ***p<0.001; F, high fat diet feeding causes periprostatic adipocyte hypertrophy and increased production of MCP-1. MCP-1 is a chemokine that is important for recruitment of blood monocytes into periprostatic adipose tissue where they undergo differentiation and become macrophages leading to the formation of crown-like structures (CLS). Pioglitazone induces adiponectin and its receptor (AdipoR2) which act, in turn, to block MCP-1 expression leading to a reduction in CLS.

Similar articles

Cited by

References

    1. Discacciati A, Orsini N, Wolk A. Body mass index and incidence of localized and advanced prostate cancer--a dose-response meta-analysis of prospective studies. Ann Oncol. 2012;23(7):1665–71. doi: 10.1093/annonc/mdr603. - DOI - PubMed
    1. Cao Y, Ma J. Body mass index, prostate cancer-specific mortality, and biochemical recurrence: a systematic review and meta-analysis. Cancer Prev Res (Phila) 2011;4(4):486–501. doi: 10.1158/1940-6207.CAPR-10-0229. - DOI - PMC - PubMed
    1. Zhang X, Zhou G, Sun B, Zhao G, Liu D, Sun J, et al. Impact of obesity upon prostate cancer-associated mortality: A meta-analysis of 17 cohort studies. Oncol Lett. 2015;9(3):1307–12. doi: 10.3892/ol.2014.2841. - DOI - PMC - PubMed
    1. Hammarsten J, Hogstedt B. Hyperinsulinaemia: a prospective risk factor for lethal clinical prostate cancer. Eur J Cancer. 2005;41(18):2887–95. doi S0959-8049(05)00765-3 [pii] 10.1016/j.ejca.2005.09.003. - PubMed
    1. Allott EH, Howard LE, Cooperberg MR, Kane CJ, Aronson WJ, Terris MK, et al. Serum lipid profile and risk of prostate cancer recurrence: Results from the SEARCH database. Cancer Epidemiol Biomarkers Prev. 2014;23(11):2349–56. doi: 10.1158/1055-9965.EPI-14-0458. - DOI - PMC - PubMed

Publication types

MeSH terms