. 2017 Dec 7;68(5):885-900.e6.
doi: 10.1016/j.molcel.2017.11.007.

A Unique ISR Program Determines Cellular Responses to Chronic Stress

Affiliations

A Unique ISR Program Determines Cellular Responses to Chronic Stress

Bo-Jhih Guan et al. Mol Cell. .

Abstract

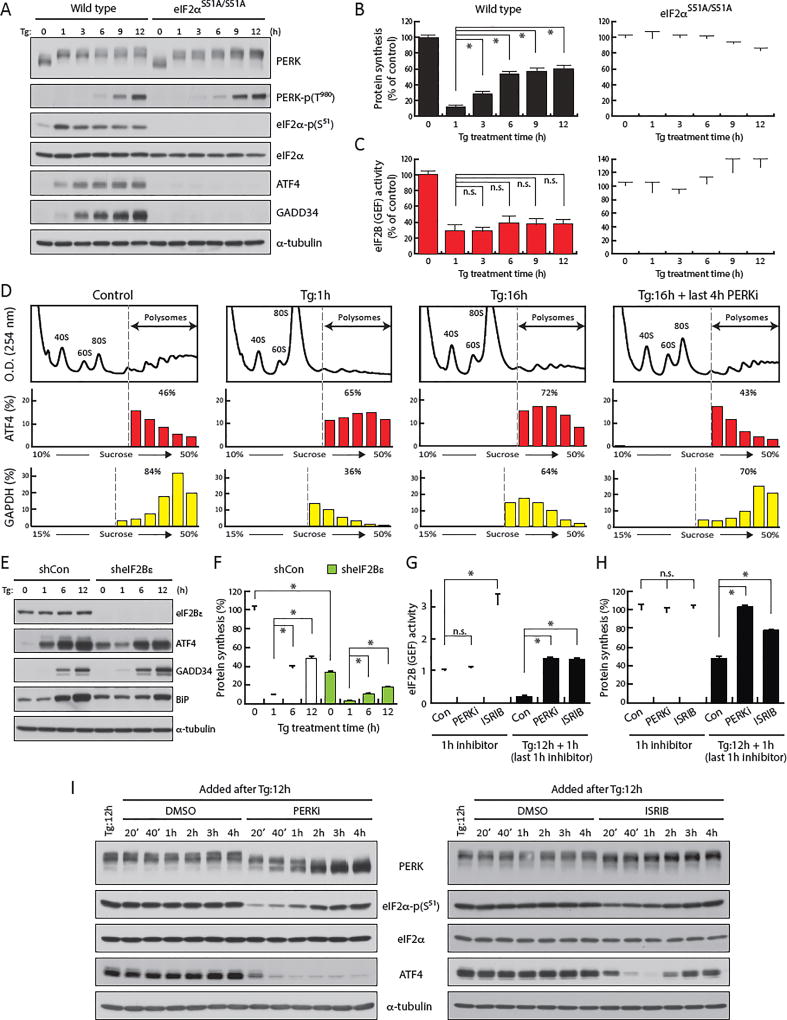
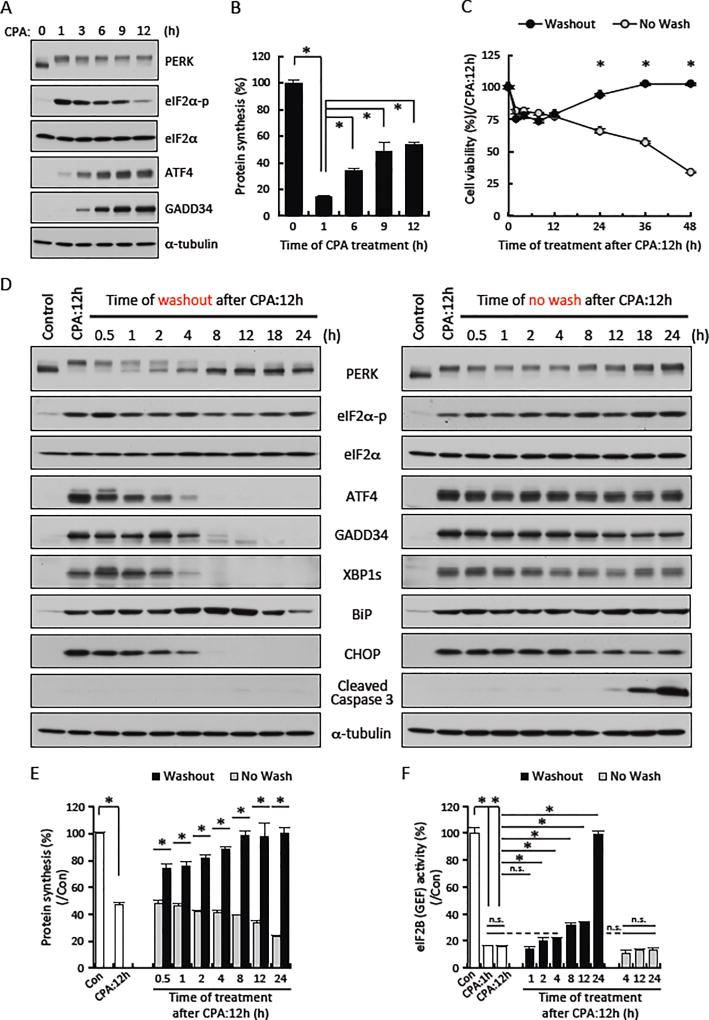
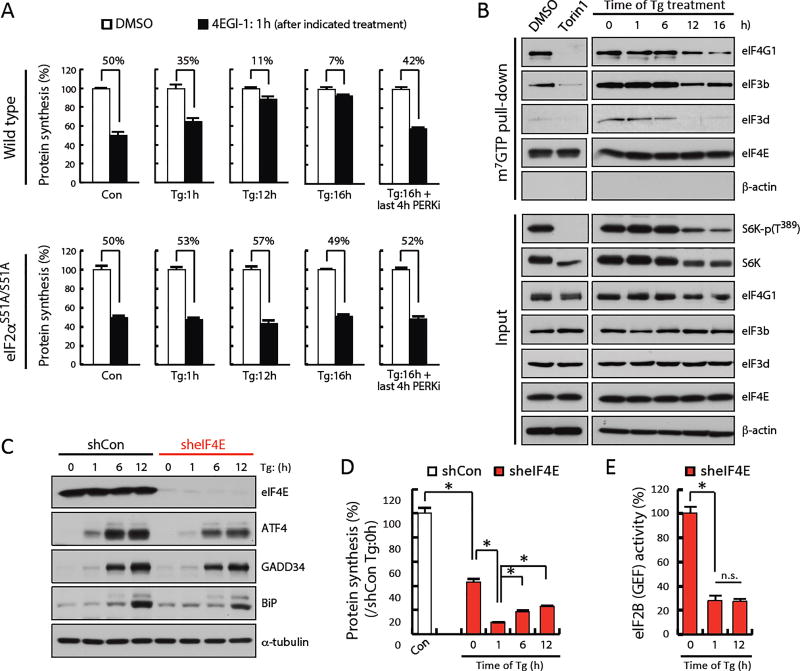
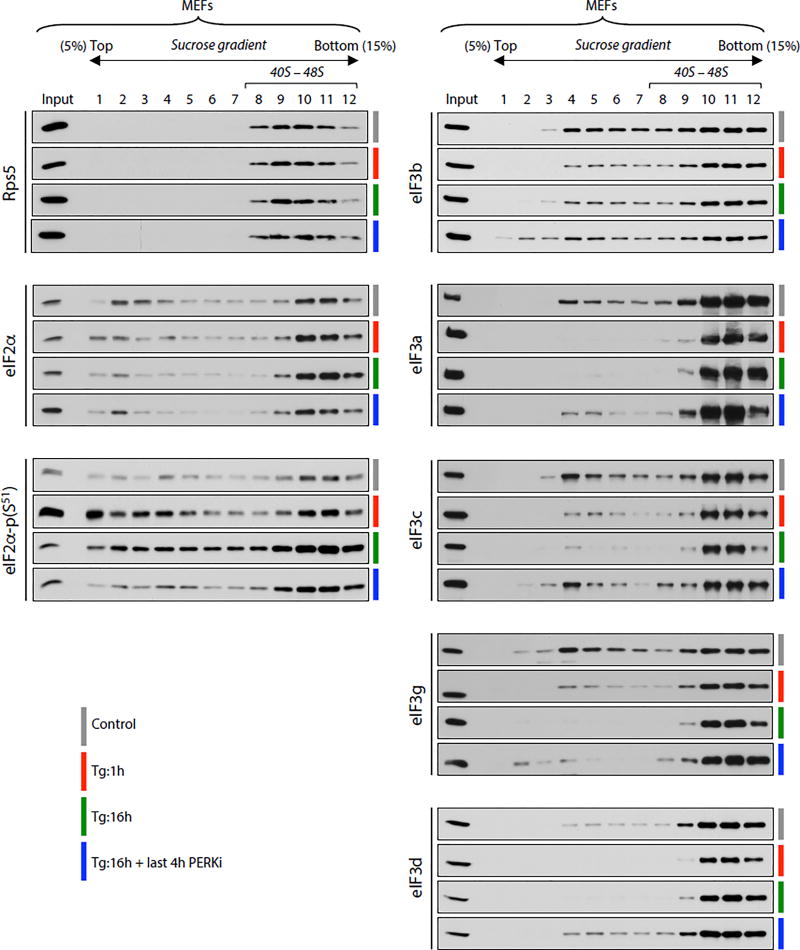
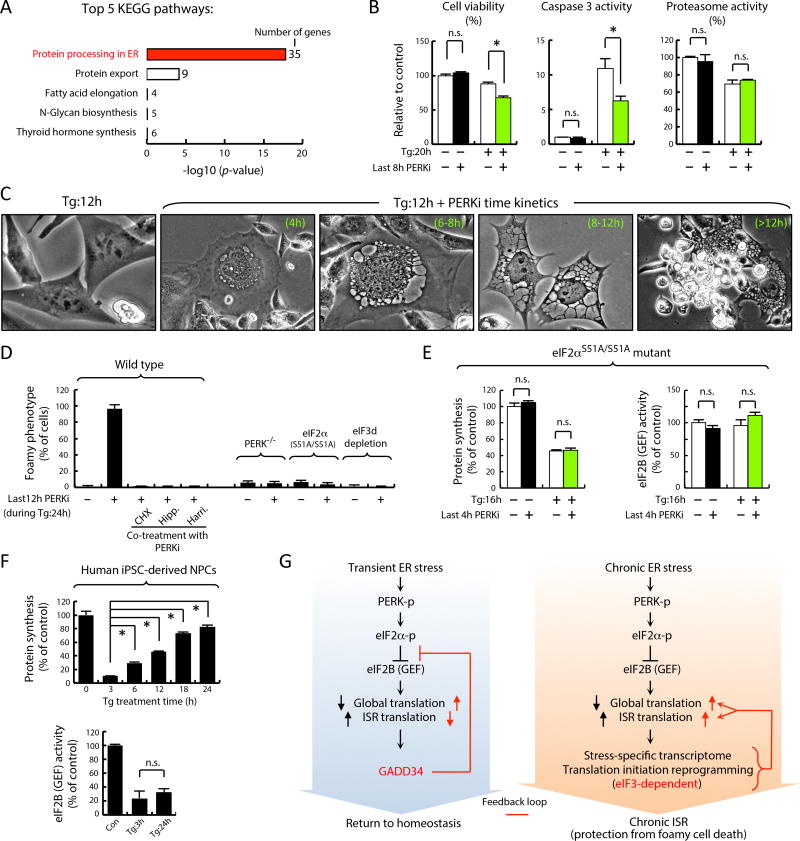
The integrated stress response (ISR) is a homeostatic mechanism induced by endoplasmic reticulum (ER) stress. In acute/transient ER stress, decreased global protein synthesis and increased uORF mRNA translation are followed by normalization of protein synthesis. Here, we report a dramatically different response during chronic ER stress. This chronic ISR program is characterized by persistently elevated uORF mRNA translation and concurrent gene expression reprogramming, which permits simultaneous stress sensing and proteostasis. The program includes PERK-dependent switching to an eIF3-dependent translation initiation mechanism, resulting in partial, but not complete, translational recovery, which, together with transcriptional reprogramming, selectively bolsters expression of proteins with ER functions. Coordination of transcriptional and translational reprogramming prevents ER dysfunction and inhibits "foamy cell" development, thus establishing a molecular basis for understanding human diseases associated with ER dysfunction.

Keywords: ER stress; PERK; eIF2; eIF2B; eIF3; integrated stress response; mRNA translation; protein synthesis; stress signaling; unfolded protein response.


Conflict of interest statement

The authors declare no conflicts of interest.

Figures

Figure 1
Figure 1. Translational recovery during chronic ER stress occurs without recovery of eIF2B activity
(A–C) Western blot analysis, protein synthesis, and eIF2B GEF activity measured in WT and eIF2αS51A/S51A MEFs treated with Tg as indicated. (D) Distribution of ATF4 and GAPDH mRNAs on polyribosomes isolated from MEFs treated with Tg and PERKi for the indicated times. (E–F) Western blot analysis and protein synthesis in MEFs expressing control or eIF2Bε shRNAs and treated with Tg as indicated. The mean ± S.E.M. of triplicate determinations is shown. * p < 0.01 (G–I) eIF2B GEF activity, protein synthesis, and Western blot analysis for the indicated treatments. * p < 0.01; n.s., not significant.
Figure 2
Figure 2. The unique ISR program during chronic ER stress promotes adaptation
(A–B) Western blot analysis and protein synthesis in MEFs treated with CPA for the indicated times. (C–F) Cell viability, Western blot analysis, protein synthesis, and eIF2B GEF activity in MEFs treated with CPA for the indicated times, or treated with CPA for 12 h followed by washout or no wash for the indicated times. In (C), cell viability of CPA for 12 h is set as 100%. The mean ± S.E.M. of triplicate determinations is shown. * p < 0.01; n.s., not significant.
Figure 3
Figure 3. Remodeling of translation initiation during chronic ER stress is eIF4Findependent
(A) Protein synthesis in WT and eIF2αS51A/S51A MEFs treated with Tg and 4EGI-1 or its vehicle (DMSO) as indicated. Note that 4EGI-1 treated in WT and eIF2αS51A/S51A MEFs are 100 and 200 µM, respectively, to bring down protein synthesis to a similar level (50%). (B) Western blot analysis of the indicated proteins isolated via a cap (m7GTP) pull-down assay from cell extracts (input) of MEFs treated with Tg for the indicated times. Torin 1 (250 nM) 1 h was assayed as a control. (C–E) Western blot analysis, protein synthesis, and eIF2B GEF activity measured in MEFs expressing control or eIF4E shRNAs and treated with Tg as indicated. * p < 0.01; n.s., not significant.
Figure 4
Figure 4. Reprogramming of translation initiation during chronic ER stress is eIF3-dependent
(A) Overview of the UV crosslinking and oligo (dT) capture assay for mRNA binding proteins. (B–C) Silver staining and Western blot analysis of SDS-PAGE as described in Figure 4A. See STAR Methods for details. Input represents loading of equal amount of proteins. Oligo (dT) represents loading of equal O.D. (260 nm) of eluted poly (A+) RNA. (D–F) Protein synthesis and Western blot analysis in MEFs expressing the indicated shRNAs (control, eIF3a, eIF3c, eIF3g, eIF3d, and eIF3l) and treated with Tg as indicated. (G) Protein synthesis and eIF2B GEF activity in MEFs expressing eIF3d shRNAs and treated as indicated. The mean ± S.E.M. of triplicate determinations is shown. * p < 0.01; n.s., not significant. (H) RT-qPCR analysis of the indicated RNAs isolated from cytosolic extracts (top) or anti-eIF3d immunoprecipitates (bottom) from MEFs treated as indicated. (Top) Signals were normalized to β-actin mRNA first and set as value 1 in unstressed samples subsequently. (Bottom) The eIF3d-IP RNA signals were first normalized to respective cytosolic RNA levels (from top) and set as value 1 in unstressed samples subsequently. In both panels, data are presented as fold change. (I) Model of the eIF3-dependent translation initiation during chronic ER stress.
Figure 5
Figure 5. Regulation of preinitiation complex assembly during chronic ER stress
MEFs were treated as indicated and formaldehyde cross-linked cytosolic extracts were analyzed on sucrose gradients followed by Western blot analysis (see STAR Methods). Equal amount of protein (input) was analyzed in parallel. Fractions containing the preinitiation complex were marked (40S–48S).
Figure 6
Figure 6. Chronic ER stress is associated with modulation of mRNA levels whose translation is insulated from mechanisms controlling translational efficiency during the acute phase
(A) Overview of experimental setup. (B) Scatterplots of fold changes in Tg:1h vs. Tg:0h (acute phase) and Tg:16h vs. Tg:1h (chronic phase) using data from cytosolic or polysome-associated RNA. Transcripts showing differential translation or congruent changes are color coded and summarized in pie charts. (colors correspond to those of regulatory patterns in scatterplot; white indicates the proportion of the chronic phase response that was not observed during acute phase). (C) Boxplots of residuals from a linear regression of polysome-associated mRNA on cytosolic mRNA (Tg:1h vs. Tg:0h, left)(Tg:16h vs. Tg:1h, right)(scatter plots shown in Figure S5E). D: down-regulated; N: non-regulated; U: up-regulated (color scheme as in Figure 6B). p-values assess differences to the non-regulated group. *p < 0.05, ** p < 0.005, *** p < 0.0005. (D) 5' UTR characteristics of differentially translated mRNAs during acute stress (top row) or genes regulated congruently during chronic stress (bottom row). Color scheme described as in Figure 6B. D, N, U, and statistics defined as in Figure 6C. (E) Scatterplot of log2 fold changes comparing last 4 h of PERKi treatment during chronic stress to chronic stress (Tg:16h+PERKi vs. Tg:16h) using data as described and pie chart summarized in Figure 6B. (F) Cumulative distributions for log2 fold changes of selected gene signatures compared to all genes for the acute phase, chronic phase and Tg:16h+PERKi vs. Tg:16h using cytosolic (top row) and polysome-associated (bottom row) data. Mean log2 fold change as compared to background and associated p-values are indicated for each signature. (G) Number of genes overlapping between those congruently regulated during chronic phase, congruently regulated following PERKi, and transcriptional ATF4/CHOP targets (Han et al., 2013).
Figure 7
Figure 7. Recovery of eIF2B activity during chronic ER stress causes ER dysfunction and induces a “foamy cell” phenotype
(A) Pathway analysis of the “congruent up” genes from polysome/RNAseq of Tg:16h vs. Tg:1h (Figure 6B). X-axis shows p-value for the top 5 most significant pathways identified. (B) Cell viability, caspase 3 activity and proteasome activity in MEFs treated as indicated. (C) Representative phase-contrast microscopic images of MEFs treated with Tg for 12h (first panel) or for 24h with addition of PERKi after the first 12h of Tg (panels 2–5). (D) Quantification of foamy cells in the indicated MEFs treated with Tg:24h alone or with PERKi and cycloheximide (CHX), hippuristanol (Hipp.), or harringtonine (Harri.) for last 12h as indicated. (E–F) Protein synthesis and eIF2B GEF activity in eIF2αS51A/S51A MEFs (E) and human iPSC-derived NPCs (F) treated as indicated. The mean ± S.E.M. of triplicate determinations is shown. * p < 0.01; n.s., not significant. (G) Schematic representation of ISR programs that determine cellular responses to ER stress. In acute/transient ER stress, protein homeostasis is achieved via GADD34-dependent feedback on de-phosphorylating eIF2α-P(S51) and restoring the eIF2B GEF activity. In chronic ER stress, a unique program, defined here as chronic ISR, is achieved via an eIF3-dependent translation initiation reprogramming. Chronic ISR sustains ER function and protects cells from a foamytype cell death.

Similar articles

Cited by

References

    1. Andreev DE, O'Connor PB, Fahey C, Kenny EM, Terenin IM, Dmitriev SE, Cormican P, Morris DW, Shatsky IN, Baranov PV. Translation of 5' leaders is pervasive in genes resistant to eIF2 repression. eLife. 2015;4:e03971. - PMC - PubMed
    1. Atkins C, Liu Q, Minthorn E, Zhang SY, Figueroa DJ, Moss K, Stanley TB, Sanders B, Goetz A, Gaul N, et al. Characterization of a novel PERK kinase inhibitor with antitumor and antiangiogenic activity. Cancer research. 2013;73:1993–2002. - PubMed
    1. Baird TD, Palam LR, Fusakio ME, Willy JA, Davis CM, McClintick JN, Anthony TG, Wek RC. Selective mRNA translation during eIF2 phosphorylation induces expression of IBTKalpha. Molecular biology of the cell. 2014;25:1686–1697. - PMC - PubMed
    1. Bordeleau ME, Mori A, Oberer M, Lindqvist L, Chard LS, Higa T, Belsham GJ, Wagner G, Tanaka J, Pelletier J. Functional characterization of IRESes by an inhibitor of the RNA helicase eIF4A. Nature chemical biology. 2006;2:213–220. - PubMed
    1. Castello A, Horos R, Strein C, Fischer B, Eichelbaum K, Steinmetz LM, Krijgsveld J, Hentze MW. Comprehensive Identification of RNA-Binding Proteins by RNA Interactome Capture. Methods in molecular biology (Clifton, N.J.) 2016;1358:131–139. - PubMed

MeSH terms