ROCK-dependent phosphorylation of NUP62 regulates p63 nuclear transport and squamous cell carcinoma proliferation
- PMID: 29217659
- PMCID: PMC5757218
- DOI: 10.15252/embr.201744523
ROCK-dependent phosphorylation of NUP62 regulates p63 nuclear transport and squamous cell carcinoma proliferation
Abstract
p63, more specifically its ΔNp63α isoform, plays essential roles in squamous cell carcinomas (SCCs), yet the mechanisms controlling its nuclear transport remain unknown. Nucleoporins (NUPs) are a family of proteins building nuclear pore complexes (NPC) and mediating nuclear transport across the nuclear envelope. Recent evidence suggests a cell type-specific function for certain NUPs; however, the significance of NUPs in SCC biology remains unknown. In this study, we show that nucleoporin 62 (NUP62) is highly expressed in stratified squamous epithelia and is further elevated in SCCs. Depletion of NUP62 inhibits proliferation and augments differentiation of SCC cells. The impaired ability to maintain the undifferentiated status is associated with defects in ΔNp63α nuclear transport. We further find that differentiation-inducible Rho kinase reduces the interaction between NUP62 and ΔNp63α by phosphorylation of phenylalanine-glycine regions of NUP62, attenuating ΔNp63α nuclear import. Our results characterize NUP62 as a gatekeeper for ΔNp63α and uncover its role in the control of cell fate through regulation of ΔNp63α nuclear transport in SCC.
© 2017 The Authors.
Figures

Heat map representing NUPs transcript levels across healthy tissues including skin, esophagus, bone morrow, brain, muscle, salivary grand, pancreas and liver from The Human Protein Atlas (see URLs).
Human H1 embryonic stem cells were differentiated to keratinocyte progenitors in vitro, and their global RNA expression profiles during differentiation were analyzed using RNA‐seq. Rectangle highlights NUP62.
Expression profiles of NUP62 and IVL in normal skin tissue. Bar = 30 μm.
Heat map showing the expression of NUP62 in non‐tumor tissue, and primary head and neck squamous cell carcinoma (HNSCC) samples from TCGA. SI, SII, SIII, SIV denote stages I, II, III and IV.
NUPs expression levels in cervical squamous cell carcinoma (CSCC) samples. NUP62 mRNA levels were retrieved from GEO (accession number is shown above the figure). Five data in healthy human samples (N) and 40 data in tumor patients (T). P values are based on unpaired two‐tailed t‐test with **indicating P < 0.01. n.s. indicates not significant.
Western blot analysis of each NUP in SCC cells at 72 h after siRNA‐mediated knockdown.
Plot showing the correlation between average effect of NUP depletion on SAS cell growth and differential gene expression (normal tissue versus HNSCC from TCGA). NUP62 was highlighted in orange. TP63 was marked in purple as positive control for oncogene. Data show mean from two independent experiments (n = 2).
Summary of correlation coefficient between each NUPs mRNA and epidermal differentiation genes (SPRR1B and IVL) in head and neck SCC from TCGA.
qRT–PCR analysis of genes associated with epidermal differentiation after individual depletion of each NUPs. Transcripts of each gene with scrambled siRNAs is considered 1.0. Data show mean ± SD (n = 3; NUP62i) or mean (n = 2; others). P values are based on one sample t‐test with *indicating P < 0.05.
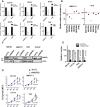
- A
Levels of transcripts in cells depleted of the indicated NUPs were measured by qRT–PCR. Transcript levels of each NUPs with scrambled siRNAs are considered 100%. Data show mean from two independent experiments (n = 2).
- B
Relative viable number of UMSCC1 and SAS SCC cells depleted of each NUP after siRNA treatment compared to transfection with scrambled siRNA (Control). Value of cells with scrambled siRNAs is considered 100%. Data show mean from two independent experiments (n = 2).
- C
Western blot analysis of NUP62 in various SCC cell lines expressing shRNA NUP62.
- D, E
SCC cells expressing shRNA NUP62 were examined by MTT assay (D) and foci formation assay (E). Number of colonies from cells expressing shRNA control is considered 100%. Data show mean ± SD from three independent experiments (n = 3). P‐values are based on unpaired two‐tailed t‐test (D) or one sample t‐test (E) with *P < 0.05, **P < 0.01.

Western blot analysis of NUP62 in SCC cells after siRNA‐mediated NUP62 depletion.
Proliferation of NUP62‐silenced SCC cells examined by MTT assay. Data show mean ± SD from three independent experiments (n = 3). P values are based on unpaired two‐tailed t‐test with *indicating P < 0.05 and **P < 0.01.
qRT–PCR analysis of differentiation related genes in SCC cell line treated with scrambled siRNAs (CTLi) or NUP62 siRNAs (NUP62i). Data show mean ± SD from three independent experiments (n = 3). P values are based on one sample t‐test with *indicating P < 0.05.
Heat map showing mutual exclusivity between NUP62 expression and differentiation related genes. Samples were divided according to mRNA expression levels [mRNA expression z‐Scores (RNA‐Seq V2 RSEM) > mean + 0.1 SD] from the TCGA cohorts. P values are based on fisher exact test.

Heat map from microarray data showing up‐ and down‐regulated genes after 3 days of knockdown of NUP62.
GO analysis of the up‐regulated genes upon NUP62 depletion.
GSEA of NUP62 knockdown microarray datasets with down‐regulated genes in HNSCC cell upon p63 knockdown (GSE88833).
qRT–PCR analysis of p63 and NUP62 mRNA in various SCC cell lines depleted of NUP62. Expression levels of cells treated with scrambled siRNAs is considered 100%. Data show mean ± SD from three independent experiments (n = 3). P values are based on one sample t‐test with *indicating P < 0.05 and **P < 0.01.
Western blot analysis of ΔNp63α in SCC cells after siRNA‐mediated NUP62 depletion.
- A, B
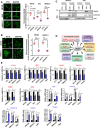
Immunofluorescence confocal microscopic analysis of ΔNp63α in SCC cells after transient depletion of NUP62 by siRNA (72 h post transfection), (A) and shRNA (B). Representative pictures [bar: 10 μm (A) and 20 μm (B)] and the quantifications as ratio of nuclear/cytoplasm signals were presented as scatter plot with mean ± SD from three independent experiments (n = 3). P values are based on unpaired two‐tailed t‐test with *indicating P < 0.05 and **P < 0.01.
- C
Western blot analysis of ΔNp63α protein levels in cytosol and nuclear fractions of SCC cells depleted NUP62.
- D
Transcriptional targets of ΔNp63α, grouped according to their known functions. Red; activated genes, Blue; suppressed genes.
- E
qRT–PCR analysis of ΔNp63α target genes mRNA in SCC cells depleted NUP62. Expression levels of cells treated with scrambled siRNAs is considered 100%. Data show mean ± SD from three independent experiments (n = 3). P values are based on one sample t‐test with *indicating P < 0.05 and **P < 0.01.


Pathway analysis of the up‐regulated genes upon NUP62 depletion.
GSEA after NUP62 knockdown with up‐regulated genes by ROCK inhibition microarray datasets (GSE61226).
Immunofluorescence confocal microscopic analysis of ΔNp63α in SCC cells treated with ROCK1 inhibitor (Y27632, 10 μM, 24 h). Representative pictures (bar: 10 μm) and quantification as a ratio of nuclear/cytoplasm signals presented as a scatter plot with mean ± SD from three independent experiments (n = 3). P value are based on unpaired two‐tailed t‐test with *indicating P < 0.05.
qRT–PCR analysis of ΔNp63α target genes mRNA in SCC cells after Y27632 treatment (24 h, 10 μM). Expression levels of cells treated with scrambled siRNAs is considered 100%. Data show mean ± SD from three independent experiments (n = 3). P values are based on one sample t‐test with *indicating P < 0.05.
Western blot analysis of exogenous constitutively active form of ROCK1 (Δ3‐ROCK1).
Immunofluorescence confocal microscopic analysis of ΔNp63α in SCC cells expressing Δ3‐ROCK1 and the effect of ROCK inhibitor (Y27632, 10 μM, 24 h). Representative pictures (bar: 10 μm) and quantification as a ratio of nuclear/cytoplasm signals presented as a scatter plot with mean ± SD from three independent experiments (n = 3). P values are based on unpaired two‐tailed t‐test with **indicating P < 0.01.
Proliferation of SCC cells expressing Δ3‐ROCK1 and effect of Y27632 (10 μM, analyzed by MTT assay). Data show mean ± SD from three independent experiments (n = 3). P values are based on unpaired two‐tailed t‐test with *indicating P < 0.05. and **P < 0.01.
qRT–PCR analysis of IVL and SPRR1B mRNA in SCC cells treated with Y27632. Expression levels of cells with DMSO is considered 100%. Data show mean ± SD from three independent experiments (n = 3). P values are based on one sample t‐test with *indicating P < 0.05 and **P < 0.01.
- A
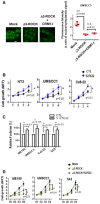
Immunofluorescence confocal microscopic analysis of ΔNp63α in SCC cells expressing Δ3‐ROCK1, and the effect of CRM1 inhibitor (Leptomycin B, 10 μM, 24 h) on the cells. Representative pictures (bar: 10 μm) and quantification as a ratio of nuclear/cytoplasm signals presented as a scatter plot with mean ± SD from three independent experiments (n = 3). P values are based on unpaired two‐tailed t‐test with **indicating P < 0.01. n.s. indicates not significant.
- B, C
SCC cell lines under Y27632 treatment (10 μM) were subjected to MTT assay (B) and foci formation assay (C). Number of colonies of control cells is considered 100%. Data show mean ± SD from three independents (n = 3). P values are based on two‐tailed t‐test (B) or one sample t‐test (C) with *indicating P < 0.05.
- D
Proliferation of SCC cells expressing Δ3‐ROCK1 and the effect of Y27632 (10 μM) were analyzed by MTT assay. Data show mean ± SD from three independents (n = 3). P values are based on unpaired two‐tailed t‐test with *indicating P < 0.05.
- A
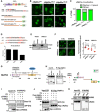
Schematic representation of the structural and functional domains of ΔNp63α. DBD, DNA binding domain; OD, Oligomerization; TA, Transactivation; SAM, Steric a‐motif; TID, transactivation inhibitory domain (upper panel). Predicted NLSs in ΔNp63α by NLS mapper (middle panel). Diagram of mutations conducted in ΔNp63α (bottom panel).
- B, C
Immunofluorescence confocal microscopic analysis of ΔNp63αWT, ΔNp63α∆NLS1 and ΔNp63α∆NLS2 in 293T. Representative pictures are shown (B). Bar indicates 10 mm. Phenotypes are quantified by counting [n = 2, (C)].
- D
Comparison of NLS score p53, p73 and p63.
- E
Western blot analysis of KPNB1 in SCC cells after siRNA knockdown.
- F
Immunofluorescence confocal microscopic analysis of ΔNp63α in KPNB1 silenced SCC cells. Representative pictures (bar: 10 mm) and quantification as a ratio of nuclear/cytoplasm signals presented as scatter plot with mean ± SD from three independent experiments (n = 3). P values are based on unpaired two‐tailed t‐test with *indicating P < 0.05.
- G
Schematic representation of the structural and functional domains of NUP62. FG., FG repeat, CC., coiled‐coil domain.
- H
Schematic representation of NUP62 GFP fusion constructs overexpressed in HEK293T cells. HEK293T cells were co‐transfected with Flag‐tagged ΔNp63α and GFP‐fused NUP62 fragments (FG, Middle, and CC as shown in right panel). Seventy‐two hours after transfection, cells were harvested, lysed, followed by immunoprecipitation (IP) assay using an anti‐Flag antibody. Potential phosphorylation sites on FG is indicated.
- I, J
HEK293T cells were co‐transfected with FG, Δ3‐ROCK1 (I), together with Flag‐tagged ΔNp63α (J). Twenty‐four hours after transfection, cells were treated with Y27632 (24 h, 10 μM). At 72 h after transfection, cells were harvested, lysed, and proceeded for IP assay using indicated antibody.
- K
Interaction between ectopic NUP62 and ΔNp63α is shown either with wild‐type NUP62 (WT) or with a point mutation in the S2 and T20 of FG (Amt).

Western blot analysis of ΔNp63α and KPNB1.
Evolutionarily conserved phosphorylation sites in FG domain of NUP62.
Quantification of Western blots results showing ROCK1 activation resulted in elevated phosphorylation of FG of NUP62, while Y27632 reduced this phosphorylation. The relative amount of phosphorylation was quantified by ImageJ using pull‐downed FG amounts as an internal control and normalized further to this level in control (CTL). Data show mean ± SD from three independent experiments (n = 3). P values are based on one sample t‐test with *indicating P < 0.05. n.s. indicates not significant.
Diagram of mutations made in FG domain.

- A, B
Western blot analysis of ectopic WT and Amt NUP62 in SCC cells (A), and exogenous Δ3‐ROCK1 in those cells (B).
- C
Immunofluorescence confocal microscopic analysis of ΔNp63α in SCC cells expressing either WT or Amt NUP62 after Δ3‐ROCK1 overexpression (72 h post transfection). Representative pictures (bar: 10 μm) and quantification as a ratio of nuclear/cytoplasm signals presented as a scatter plot with mean ± SD from three independent experiments (n = 3). P values are based on unpaired two‐tailed t‐test with *indicating P < 0.05 and **P < 0.01. n.s. indicate not significant.
- D
SCC cell lines expressing either WT or Amt NUP62 were subjected either to MTT assay. Data show mean ± SD from three independent experiments (n = 3). P‐values are based on unpaired two‐tailed t‐test with *indicating P < 0.05.
- E
Cross‐section image of dermis and epidermis is modified from previous report 11. Hypothetical model of NUP62 action in regulating cell fate.
- A
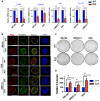
qRT–PCR analysis of ΔNp63α target genes mRNA in SCC cells expressing either WT or Amt NUP62. Expression levels of cells treated with scrambled siRNAs are considered 100%. Data show mean ± SD from three independent experiments (n = 3). P values are based on one sample t‐test with *indicating P < 0.05 and **P < 0.01.
- B
Co‐localization analysis of RanBP2 and exogenous NUP62 in SCC cells by immunofluorescence confocal microscopy. Representative pictures are shown (bar: 10 μm).
- C, D
Various SCC cell lines expressing either WT or Amt NUP62 were subjected to foci formation assay (C). Number of colonies from cells expressing WT NUP62 is considered 100% (D). Data show mean ± SD from three independent experiments (n = 3). P values are based on one sample t‐test with *indicating P < 0.05.
Comment in
-
Nup62-mediated nuclear import of p63 in squamous cell carcinoma.EMBO Rep. 2018 Jan;19(1):3-4. doi: 10.15252/embr.201745497. Epub 2017 Dec 18. EMBO Rep. 2018. PMID: 29254932 Free PMC article.
Similar articles
-
Molecular Mechanisms of p63-Mediated Squamous Cancer Pathogenesis.Int J Mol Sci. 2019 Jul 23;20(14):3590. doi: 10.3390/ijms20143590. Int J Mol Sci. 2019. PMID: 31340447 Free PMC article. Review.
-
BGLF4 kinase modulates the structure and transport preference of the nuclear pore complex to facilitate nuclear import of Epstein-Barr virus lytic proteins.J Virol. 2015 Feb;89(3):1703-18. doi: 10.1128/JVI.02880-14. Epub 2014 Nov 19. J Virol. 2015. PMID: 25410863 Free PMC article.
-
Nucleoporin 62 and Ca(2+)/calmodulin dependent kinase kinase 2 regulate androgen receptor activity in castrate resistant prostate cancer cells.Prostate. 2016 Feb 15;76(3):294-306. doi: 10.1002/pros.23121. Epub 2015 Nov 10. Prostate. 2016. PMID: 26552607
-
Nuclear import of the MUC1-C oncoprotein is mediated by nucleoporin Nup62.J Biol Chem. 2007 Jul 6;282(27):19321-30. doi: 10.1074/jbc.M703222200. Epub 2007 May 11. J Biol Chem. 2007. PMID: 17500061
-
Deciphering the cells of origin of squamous cell carcinomas.Nat Rev Cancer. 2018 Sep;18(9):549-561. doi: 10.1038/s41568-018-0024-5. Nat Rev Cancer. 2018. PMID: 29849070 Free PMC article. Review.
Cited by
-
Unlocking the Gateway: The Spatio-Temporal Dynamics of the p53 Family Driven by the Nuclear Pores and Its Implication for the Therapeutic Approach in Cancer.Int J Mol Sci. 2024 Jul 7;25(13):7465. doi: 10.3390/ijms25137465. Int J Mol Sci. 2024. PMID: 39000572 Free PMC article. Review.
-
p63 Is a Promising Marker in the Diagnosis of Unusual Skin Cancer.Int J Mol Sci. 2019 Nov 17;20(22):5781. doi: 10.3390/ijms20225781. Int J Mol Sci. 2019. PMID: 31744230 Free PMC article. Review.
-
New Activities of the Nuclear Pore Complexes.Cells. 2021 Aug 18;10(8):2123. doi: 10.3390/cells10082123. Cells. 2021. PMID: 34440892 Free PMC article.
-
Spatiotemporal tracking of small extracellular vesicle nanotopology in response to physicochemical stresses revealed by HS-AFM.J Extracell Vesicles. 2022 Nov;11(11):e12275. doi: 10.1002/jev2.12275. J Extracell Vesicles. 2022. PMID: 36317784 Free PMC article.
-
Functional high-throughput screen identifies microRNAs that promote butyrate-induced death in colorectal cancer cells.Mol Ther Nucleic Acids. 2022 Aug 29;30:30-47. doi: 10.1016/j.omtn.2022.08.037. eCollection 2022 Dec 13. Mol Ther Nucleic Acids. 2022. PMID: 36189423 Free PMC article.
References
-
- Cancer Genome Atlas Research Network, Analysis Working Group: Asan University, BC Cancer Agency, Brigham and Women's Hospital, Broad Institute, Brown University, Case Western Reserve University, Dana‐Farber Cancer Institute, Duke University, Greater Poland Cancer Centre et al (2017) Integrated genomic characterization of oesophageal carcinoma. Nature 541: 169–175 - PMC - PubMed
-
- Mills AA, Zheng B, Wang XJ, Vogel H, Roop DR, Bradley A (1999) p63 is a p53 homologue required for limb and epidermal morphogenesis. Nature 398: 708–713 - PubMed
Publication types
MeSH terms
Substances
LinkOut - more resources
Full Text Sources
Other Literature Sources
Medical
Molecular Biology Databases
Research Materials
Miscellaneous

