Comparative Study
. 2017 Dec 6:6:e32177.
doi: 10.7554/eLife.32177.

Single-molecule studies contrast ordered DNA replication with stochastic translesion synthesis

Affiliations
Comparative Study

Single-molecule studies contrast ordered DNA replication with stochastic translesion synthesis

Gengjing Zhao et al. Elife. .

Abstract

High fidelity replicative DNA polymerases are unable to synthesize past DNA adducts that result from diverse chemicals, reactive oxygen species or UV light. To bypass these replication blocks, cells utilize specialized translesion DNA polymerases that are intrinsically error prone and associated with mutagenesis, drug resistance, and cancer. How untimely access of translesion polymerases to DNA is prevented is poorly understood. Here we use co-localization single-molecule spectroscopy (CoSMoS) to follow the exchange of the E. coli replicative DNA polymerase Pol IIIcore with the translesion polymerases Pol II and Pol IV. We find that in contrast to the toolbelt model, the replicative and translesion polymerases do not form a stable complex on one clamp but alternate their binding. Furthermore, while the loading of clamp and Pol IIIcore is highly organized, the exchange with the translesion polymerases is stochastic and is not determined by lesion-recognition but instead a concentration-dependent competition between the polymerases.

Keywords: CoSMoS; DNA replication; E. coli; biochemistry; biophysics; single-molecule; structural biology; translesion DNA synthesis.


Conflict of interest statement

No competing interests declared.

Figures
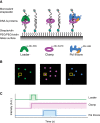
Figure 1.
Figure 1.. Experimental setup.
(A) Schematic representation of the experimental setup. DNA molecules are attached to a PEGylated glass slide via a biotin-streptavidin layer, and end-blocked with monovalent streptavidin. Fluorescently labeled proteins will be detected when bound to the DNA molecules (B) Schematic representation of the three fluorescent channels from a single image (out of an 1000 image series) showing the presence of different molecules. (C) Schematic representation of kymographs from single position in the image series, revealing the binding and release of different proteins to the DNA at that position.
Figure 1—figure supplement 1.
Figure 1—figure supplement 1.. Validation of proteins, fluorophores and DNA.
(A) ϕX174 phage DNA (5.4 kb) primer extension assays, showing the activity of fluorescently labeled and unlabeled proteins. In the labeled reactions, fluorescently labeled clamp, labeled clamp loader, and labeled polymerase (Pol IIIcore, Pol II, or Pol IV) were used. Reaction were quenched at 0, 0.5, 1, 2, and 5 min. The increased background in the ‘Pol IIIcore Fluo label +" lanes is caused by the presence of αAtto488, whose fluorescent signal overlaps with that of the fluorescein label on the DNA primer (B) Coomassie stained SDS-page showing unlabeled and labeled proteins (marked with *). (C) Three-wavelength fluorescent scan of the same gel shown in B (before coomassie staining) revealing the presence of the labeled proteins. (D–F) Lifetimes of fluorescent dyes Atto 488, Atto 565, and Atto 674N under experimental conditions. The dyes were attached to the β-clamp that was loaded onto the DNA substrate used in the experiments. (G–F) Lifetime of Pol IIIcore on clamp-DNA before and after photobleaching of the Atto 488 fluorophore on the DNA substrate. All values represent mean lifetime/lag time ±s.e.m.
Figure 2.
Figure 2.. Different mechanisms for clamp loading and unloading.
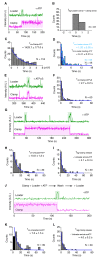
(A) Representative trace showing a clamp loading event on DNA in the presence of ATP. (B) Histogram showing the simultaneous arrival of loader and clamp on DNA (see also Figure 2—figure supplement 1C–E). (C) The distribution of lifetimes for the clamp on DNA after removal of the clamp loader (D) Lifetime of the clamp loader on DNA in the absence (blue bars) and presence (grey bars) of the clamp. (E) Representative trace showing the simultaneous arrival and release of loader and clamp on DNA in the presence of ATPγS. (F) The distribution of lifetimes for the loader and clamp on DNA in the presence of ATPγS. (G) Representative trace showing clamp loading and unloading by the loader in the presence of ATP. (H) The distribution of lifetimes for the loader on DNA during unloading. (I) The distribution of lag times between the arrival of the loader and the release of the clamp. (J) Representative trace showing unloading of a pre-loaded clamp in absence of ATP. (K) The distribution of lifetimes for the loader during clamp unloading in the absence of ATP. The first column (in dark grey) has been excluded from the fitting. The lower numbers in this column are possibly caused by the clamp that needs to be removed first before the loader can release. (L) The distribution of lag times between the arrival of the loader and the release of the clamp in the absence of ATP. All values represent mean lifetime/lag time ±s.e.m.
Figure 2—figure supplement 1.
Figure 2—figure supplement 1.. Clamp loading and clamp unloading.
(A) Self-loading and unloading of clamp on open-ended DNA. (B) Lack of self-loading of clamp on end-blocked DNA. (C) Histogram showing the simultaneous arrival of loader and clamp on DNA (same as main Figure 2B) (D) Schematic representation of how the simultaneous arrival of two proteins can be recorded in a single image or (E) on two sequential images. (F) Representative trace showing sequentially an unsuccessful and a successful clamp unloading event. (G) The distribution of lifetimes for the unsuccessful unloading attempts by the clamp loader. All values represent mean lifetime ±s.e.m.
Figure 3.
Figure 3.. Pol IIIcore binds transiently to clamp-DNA.
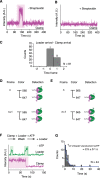
(A) Representative trace showing Pol IIIcore collisions with DNA in the absence of clamp. (B) The distribution of lifetimes for Pol IIIcore on DNA. (C) Representative trace showing Pol I binding on DNA. (D) The distribution of lifetimes for Pol I on DNA. (E) Representative trace showing Pol IIIcore binding to clamp-DNA shortly after the release of loader. (F) The distribution of lifetimes for Pol IIIcore on clamp-DNA in absence of dNTPs. (G) The distribution of lifetimes for Pol IIIcore binding events on clamp-DNA in the presence of dATP/dTTP. (H) Loading of clamp and polymerase by the τ clamp loader complex. (I) Lifetime of the τ clamp loader complex and Pol IIIcore on clamp-DNA (J) Cartoon of the binding sequence of the τ clamp loader - Pol IIIcore complex on clamp-DNA. All values represent mean lifetime ±s.e.m.
Figure 4.
Figure 4.. The replicative and translesion polymerases compete for binding to clamp-DNA.
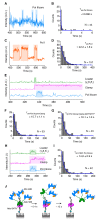
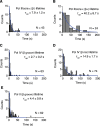
(A) Representative trace showing alternating binding of Pol IIIcore and Pol IV on clamp-DNA. (B) Lifetime of Pol IV on clamp-DNA. (C) Cartoon showing the frequency of different polymerase switching events. (D) Representative trace showing the independent arrival and release of Pol IIIcore and Pol IV on clamp-DNA during co-localization events. (E) Lifetime of the co-localization of Pol IIIcore on Pol IV on clamp-DNA. (F) Representative trace showing the simultaneous arrival and release of Pol IIIcore α subunit (polymerase) and Pol IIIcore ε subunit (exonuclease) on clamp-DNA. (G) Lifetime of the co-localization of the Pol IIIcore α subunit and Pol IIIcore ε subunit. (H) Representative trace showing alternating binding of Pol IIIcore and Pol II on clamp-DNA. (I) Lifetime of Pol II on clamp-DNA. All values represent mean lifetime ±s.e.m.
Figure 4—figure supplement 1.
Figure 4—figure supplement 1.. Concentration-dependent competition between Pol IIIcore and Pol IV.
(A–D) Histograms of the lag time between Pol IIIcore release from clamp-DNA and binding of Pol IV at increasing protein concentrations. (E–H) Histograms of the lifetime of Pol IIIcore on clamp-DNA at all four protein concentrations. See also Table 1. All values represent mean lifetime/lag time ±s.e.m.
Figure 4—figure supplement 2.
Figure 4—figure supplement 2.. Lifetimes of β-clamp binding mutants of Pol IIIcore, Pol IV and Pol II.
(A) Lifetime of Pol IIIcore with a reduced β-binding motif in the ε subunit. (B) Lifetime of Pol IIIcore with an improved β-binding motif in the ε subunit. (C) Lifetime of Pol IV with a mutated β-groove binding motif. (D) Lifetime of Pol IV with a mutated β-rim binding motif. (E) Lifetime of Pol II with a mutated β-groove binding motif. All values represent mean lifetime ±s.e.m.
Figure 4—figure supplement 3.
Figure 4—figure supplement 3.. Lesions and mismatches do not affect the lifetime of Pol IIIcore on clamp-DNA.
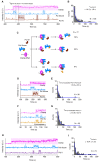
(A) The distribution of lifetimes for Pol IIIcore binding on the clamp on matched, (B) lesion, and (C) mismatched DNA. (D) The distribution of lifetimes for Pol IIIcore binding on clamp-DNA in the presence of dATP and dTTP on matched, (E) lesion, and (F) mismatched DNA. (G) All values represent mean lifetime ±s.e.m.
Figure 5.
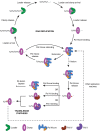
Figure 5.. A model for DNA replication and translesion synthesis.
The DNA replication cycle consists of a sequence of carefully arranged steps of clamp loading, polymerase loading, DNA synthesis, polymerase release, and clamp unloading. In contrast, translesion DNA synthesis over DNA adducts shows no coordinated sequence of events, but is instead a direct competition between the replicative DNA polymerase Pol IIIcore, and the translesion DNA polymerases Pol II and Pol IV. DNA replication will resume once the lesion has been bypassed by one of the translesion DNA polymerases.

Similar articles

Cited by

References

    1. Beattie TR, Kapadia N, Nicolas E, Uphoff S, Wollman AJ, Leake MC, Reyes-Lamothe R. Frequent exchange of the DNA polymerase during bacterial chromosome replication. eLife. 2017;6:e21763. doi: 10.7554/eLife.21763. - DOI - PMC - PubMed
    1. Becherel OJ, Fuchs RP, Wagner J. Pivotal role of the beta-clamp in translesion DNA synthesis and mutagenesis in E. coli cells. DNA Repair. 2002;1:703–708. doi: 10.1016/S1568-7864(02)00106-4. - DOI - PubMed
    1. Becherel OJ, Fuchs RPP. Mechanism of DNA polymerase II-mediated frameshift mutagenesis. PNAS. 2001;98:8566–8571. doi: 10.1073/pnas.141113398. - DOI - PMC - PubMed
    1. Bonner CA, Randall SK, Rayssiguier C, Radman M, Eritja R, Kaplan BE, McEntee K, Goodman MF. Purification and characterization of an inducible Escherichia coli DNA polymerase capable of insertion and bypass at abasic lesions in DNA. The Journal of Biological Chemistry. 1988;263:18946–18952. - PubMed
    1. Bunting KA, Roe SM, Pearl LH. Structural basis for recruitment of translesion DNA polymerase Pol IV/DinB to the beta-clamp. The EMBO Journal. 2003;22:5883–5892. doi: 10.1093/emboj/cdg568. - DOI - PMC - PubMed

Publication types

MeSH terms