. 2017 Dec 4:6:e31125.
doi: 10.7554/eLife.31125.

Cryo-EM structures reveal specialization at the myosin VI-actin interface and a mechanism of force sensitivity

Affiliations

Cryo-EM structures reveal specialization at the myosin VI-actin interface and a mechanism of force sensitivity

Pinar S Gurel et al. Elife. .

Abstract

Despite extensive scrutiny of the myosin superfamily, the lack of high-resolution structures of actin-bound states has prevented a complete description of its mechanochemical cycle and limited insight into how sequence and structural diversification of the motor domain gives rise to specialized functional properties. Here we present cryo-EM structures of the unique minus-end directed myosin VI motor domain in rigor (4.6 Å) and Mg-ADP (5.5 Å) states bound to F-actin. Comparison to the myosin IIC-F-actin rigor complex reveals an almost complete lack of conservation of residues at the actin-myosin interface despite preservation of the primary sequence regions composing it, suggesting an evolutionary path for motor specialization. Additionally, analysis of the transition from ADP to rigor provides a structural rationale for force sensitivity in this step of the mechanochemical cycle. Finally, we observe reciprocal rearrangements in actin and myosin accompanying the transition between these states, supporting a role for actin structural plasticity during force generation by myosin VI.

Keywords: Cryo-EM; actin; biophysics; cytoskeleton; molecular motors; myosin; none; structural biology.


Conflict of interest statement

No competing interests declared.

Figures
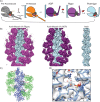
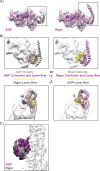
Figure 1.
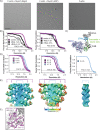
Figure 1.. High-resolution reconstructions of myosin VI bound to actin.
(A) Schematic depicting myosin VI states in the force generation cycle. Filament polarity is indicated throughout the paper with pointed end as '-' and barbed end as '+'. Cryo-EM reconstructions of actomyosin VI in the nucleotide-free (rigor) state (left), MgADP (ADP) state (middle), and actin alone (right). Actin, light blue; myosin VI, magenta (rigor) and dark magenta (ADP). (B) Atomistic model of actomyosin VI (rigor) colored corresponding to treatment during HR MDFF. Blue (actin), large side chains and backbone atoms subjected to fitting guided by density map; Green (MD), backbone atoms only subjected to fitting guided by density map; Red (MD loop 2 residues 622–636 and HCM loop residues 397–405), density term disabled due to conformational variability; Grey (ADP and Magnesium ion in actin), fixed atoms. (C) Superposition of the actin nucleotide-binding cleft from all six actomyosin interfaces in the HR MDFF rigor model, docked into the density map and colored by heteroatom. Large side chains and ADP are displayed.
Figure 1—figure supplement 1.
Figure 1—figure supplement 1.. Electron microscopy and resolution assessment.
(A) Representative micrographs of actin filaments decorated with nucleotide free myosin VI (left), Mg-ADP myosin VI (middle), and in the absence of myosin (right). Scale bar, 100 nm. (B) Fourier Shell Correlation (FSC) curves for reconstructions of actin-MyoVI rigor (left) and ADP (right) with RNA (grey), without RNA (black), and combining the two datasets (magenta). (C) Cartoon ribbon diagram of the engineered myosin VI used in this study. (D) FSC curves for reconstructions of actin-myoVI rigor state (left), ADP state (middle), and bare actin (right). FSC curves approximately corresponding to different domains were generated by radially masking reconstructions at 120 Å (full reconstruction, magenta), 90 Å (truncated MD to exclude lever arm and converter, dark magenta), and 40 Å (actin, light blue). (E) Reconstructions for actin-myoVI rigor (left), actin-myoVI ADP (middle), and bare actin (right) colored according local resolution as determined by ResMap. Radii corresponding to S1D indicated. (F) View of the HR rigor MDFF model (magenta) and the rigor-like state initial model (2BKI, grey) superimposed in the reference frame of the actin filament (light gray density). The superposition was generated based on the Cα coordinates of the full motor domain. Rigor U50, magenta; rigor L50, dark magenta; 2BKI U50, dark grey; 2BKI L50, light grey; actin density, white. Arrows denote direction of domain centroids (spheres) from 2BKI to HR rigor MDFF. Centroids were determined for the U50 (residues 180–206, 229–397, and 405–441) and L50 (residues 467–597 and 638–661) domains.
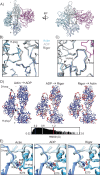
Figure 2.
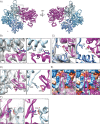
Figure 2.. Interactions composing the actomyosin VI interface in rigor.
(A) All six actomyosin interfaces from the HR MDFF rigor model, superimposed based on the Cα coordinates of the dark-blue actin subunits. MD, magenta; actin subunits, varying shades of blue. (B–D) Detail views of interface contacts suggested by MDFF, colored as in A; EM density map is displayed on left side in transparent grey. (B) Hydrophobic interface between MD HLH and actin SD1/SD3. (C) Milligan contact interactions between MD loop 3 and actin D-loop/SD1. (D) Electrostatic interaction between MD loop 4 and actin SD3. (E) Interface between MD HCM loop and loop 2 with actin surface, colored by hydrophobicity from most hydrophobic (orange) to most hydrophilic (blue). (F) Salt bridge formation between the base of the MD HCM loop with actin SD1.
Figure 2—figure supplement 1.
Figure 2—figure supplement 1.. Comparison of interactions composing the actomyosin interface between rigor-state myosin IIC and myosin VI.
(A) The rigor state myosin IIC actomyosin interface from 5JLH (von der Ecken et al., 2016) consisting of 1 MD (light pink) and three actin subunits (shades of blue), analogous to Figure 2. (B–F) Detailed views of interface contacts, colored as in A; HR rigor MDFF model, panels from Figure 2B–2F, displayed on left side for comparison. (B) Hydrophobic interaction between myosin IIC HLH and actin SD1/SD3. Panel from Figure 2B adjacent for comparison. (C) Milligan contact interactions between myosin IIC loop 3/HLH and actin D-loop/SD1. Panel from Figure 2C adjacent for comparison. (D) Putative electrostatic interactions between myosin IIC loop 4 and actin SD 3. Panel from Figure 2D adjacent for comparison. (E) Interface of myosin IIC HCM loop and loop 2 with actin surface colored by hydrophobicity from most hydrophobic (orange) to most hydrophilic (blue). Panel from Figure 2E adjacent for comparison. (F) Interactions at the base of the myosin IIC HCM loop with actin SD1. Panel from Figure 2F adjacent for comparison.
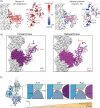
Figure 3.
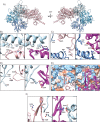
Figure 3.. A unique contact is established upon transition from ADP to rigor.
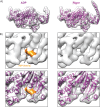
(A) View of the LPF APD MDFF model (dark magenta) and LPF rigor MDFF model superimposed in the reference frame of the actin filament (light gray density). To generate this superposition, the ADP and rigor density maps were aligned, then their corresponding atomistic models were rigid body fit into the aligned maps. (B) Minimal actin binding cleft rearrangements are observed between ADP and rigor, superimposed as described in A. ADP U50, magenta; ADP L50, dark magenta; rigor U50, dark grey; rigor L50, light grey; actin density, white. Arrows denote displacements of domain centroids (spheres) from ADP to the rigor state. Centroids were determined for U50 (residues 180–206, 229–397, and 405–441) and L50 (residues 467–597 and 638–661) domains. (C) MDFF indicates the Milligan contact cation-π interaction between R561 in the MD loop 3 and Y91 in the adjacent actin is absent in ADP (left) but is established upon transition to the rigor state (right), with clear density for these sidechains in the rigor map. For both states, all six actomyosin interfaces in the corresponding HR MDFF model are displayed superimposed on one actin subunit as described in Figure 2A. Density maps are displayed in transparent grey in the upper panels. Orange dotted circle indicates absence of density for R561 in the ADP map, while density for Y91 is still present.
Figure 3—figure supplement 1.
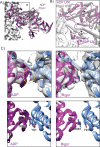
Figure 3—figure supplement 1.. Comparison of ADP and rigor motor nucleotide binding cleft.
(A) View of the MD from the LPF ADP MDFF model (left, dark magenta) and LPF rigor MDFF model (right, light magenta), rigid-body fit into their corresponding segmented density maps (transparent grey) low-pass filtered to 7.5 Å. (B) View of the boxed region indicated in panel A, comparing the myosin VI nucleotide binding cleft between ADP (left) vs. rigor (right). Top panels show density maps only; bottom panels include the rigid body fit models as described in A. Density corresponding to ADP nucleotide is orange.
Figure 3—figure supplement 2.
Figure 3—figure supplement 2.. Validation of ADP MDFF model.
Per-residue Cα RMSD is displayed between superpositions of backbone-averaged HR MDFF models. The superposition was generated based on the Cα coordinates of the indicated full motor domains. The backbone of the first state indicated is displayed and colored. Differences of the lowest magnitude occur between ADP from 2BKI vs. ADP from 4PFO.
Figure 3—figure supplement 3.
Figure 3—figure supplement 3.. Interactions composing the actomyosin VI interface in the ADP state.
(A) All six actomyosin interfaces from the HR ADP MDFF model, superimposed based on the Cα coordinates of actin protomer 1 (dark-blue), as described in Figure 2A. MD, dark magenta; actin subunits, varying shades of blue. (B–F) Detailed views of interface contacts suggested by MDFF, colored as in A. EM density map is displayed on left side in transparent grey. (B) Hydrophobic interaction between MD HLH and actin SD1/SD3. (C) Milligan contact interactions between MD loop 3 and actin D-loop/SD1. (D) Electrostatic interaction between MD loop 4 and actin SD 3. (E) Interface of MD HCM loop and loop 2 with actin surface colored by hydrophobicity from most hydrophobic (orange) to most hydrophilic (blue). (F) Salt bridge formation between the base of the MD HCM loop with actin SD1.
Figure 3—figure supplement 4.
Figure 3—figure supplement 4.. Comparison of interactions composing the actomyosin VI interface between ADP and rigor.
(A) All six actomyosin interfaces from the HR ADP MDFF model as described in Figure 3—figure supplement 3. MD, dark magenta; actin subunits, varying shades of blue. (B–F) Detailed views of interface contacts, colored as in A; HR rigor MDFF model, panels from Figure 2B–2F, displayed on left side for comparison. (B) Hydrophobic interaction between MD HLH and actin SD1/SD3. (C) Milligan contact interactions between MD loop 3 and actin D-loop/SD1. (D) Electrostatic interaction between MD loop 4 and actin SD 3. (E) Interface of MD HCM loop and loop two with actin surface colored by hydrophobicity from most hydrophobic (orange) to most hydrophilic (blue). (F) Salt bridge formation between the base of the MD HCM loop with actin SD1.
Figure 3—figure supplement 5.
Figure 3—figure supplement 5.. Transducer rearrangement comparisons between myosins V and VI.
Transducer rearrangements between ADP and Rigor. Top panels: View of the transducer from the LPF ADP MDFF model (right, purple) and LPF rigor MDFF model (left, magenta), rigid body fit into their corresponding density maps. Bottom panels: Comparison of the myosin VI (left) and myosin V (right) transducer. View of the superposition of LPF ADP MDFF (purple) and LPF rigor MDFF (magenta) models, and Myosin V ADP (EMDB 31289, dark green) and rigor (EMDB 31288, green) structures. To generate these superpositions, the ADP and rigor density maps were aligned, then their corresponding atomistic models were rigid body fit into the aligned maps.
Figure 3—figure supplement 6.
Figure 3—figure supplement 6.. Milligan contact comparisons between myosins IIC, V, and VI.
(A) MDFF indicates the Milligan contact cation-π interaction between R561 in the MD loop three and Y91 in the adjacent actin is absent in ADP (left) and ADP from 2BKI (right) but is established upon transition to the rigor state (middle). For all three states, all six actomyosin interfaces in the corresponding HR MDFF model are displayed superimposed on one actin subunit as described in Figure 2A. (B) Myosin V R542, analogous to R561 in myosin VI, does not form a cation-π interaction with actin Y91 in ADP (left, dark green) or rigor (right, green). Actin is displayed in dark grey. (C) Myosin IIC (light pink, PDB 5JLH) Milligan contact does not form a cation-π interaction with (non-muscle) actin Y90 (grey).
Figure 4.
Figure 4.. The converter adopts the post-power stroke conformation in the ADP state accompanied by switch II closure.
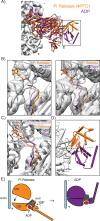
(A) View of the crystal structure of the PiR state (orange, 4PFO) superimposed on the LPF ADP MDFF model (dark magenta) based on the Cα coordinates of the full motor domain. Actin density is displayed in light grey. (B) Comparison of swII orientation between the PiR and ADP (left) and PiR and Rigor (right), superimposed as described in A. Density maps for ADP (left) and rigor (right) are displayed. ADP from PiR state is displayed in ball and stick representation and colored by heteroatom. (C) Comparison of swII orientations (various colors) between five states in the force generation cycle. The ADP and rigor maps were aligned, then their corresponding atomistic models were rigid body fit into the aligned maps. MDs from crystal structures were then superimposed based on the Cα coordinates of the full motor domain utilizing ADP as the reference for PiR and PPS, and rigor as the reference for Post-rigor. ADP from PiR is displayed in ball and stick representation and colored by heteroatom. (D) Magnified view of the 120° rotation of the converter and lever arm upon the transition from the PiR state to the ADP state as displayed in A. (E) Schematic depicting the myosin VI transition from PiR to ADP.
Figure 4—figure supplement 1.
Figure 4—figure supplement 1.. Comparison of converter modeling in Pi Release vs. ADP.
Segmented converter and lever arms from x-ray structures of pre-lever arm swing states (PPS and PiR) and post-lever arm swing states (Rigor-like) were rigid-body fit into the segmented ADP density map corresponding to this region, low pass filtered to 7.5 Å. Left panel is analogous to Figure 4D. Converter and lever arms are rainbow-colored from N-terminus (blue, S707) to C-terminus (red, indicated). Cross-correlation scores of fits are indicated.
Figure 5.
Figure 5.. Nucleotide release promotes a converter rotation coupled to lever arm bending.
(A) Opening of the MD nucleotide-binding cleft depicted by vector traces of Cα displacement from the ADP to the rigor LPF MDFF model of highlighted loops, after aligning the models as described in Figure 3A. Displacement vectors are scaled by 1.5 and depicted as transparent rods extending from the ADP LPF MDFF model protein backbone. Coloring is as follows: N-term loop 1 (residues 96–106), blue; N-term loop 2 (residues 305–312), yellow; switch I (residues 193–205), teal; P loop (residues 151–156), pink; cleft loop (residues 670–684), dark magenta, non-highlighted areas, grey. An ADP molecule (ball and stick representation colored by heteroatom) is provided as a visual guide to orient the view. Segmented density from the ADP reconstruction attributable to nucleotide is displayed in transparent grey. (B) Shifted view from A, highlighting the winding of the relay helix (yellow) and translocation of the SH1 helix (red) coupled to opening of the cleft loop (dark magenta). (C) Fit of models with lever arms grafted from crystal structure 3GN4 (orange and red) into their respective density maps filtered at 7.5 Å: ADP (left, magenta), rigor (right, dark magenta). Sites where models were joined are indicated. Orange portion of 3GN4 indicates region that was rigid-body fit into the density maps. Positioning of the red portion is extrapolated from the crystal structure. (D) Converter rotation parallel to filament axis (left) and lever arm bend perpendicular to filament axis (right) between ADP (purple) and rigor (grey). The ADP MD is displayed in surface representation; actin density is light grey. To highlight converter rearrangements, converters are depicted in pipe and plank representation, with the ADP converter in yellow. Extended lever arm models are shown in ribbon representation, with calmodulins depicted in transparent pipe and plank. To generate the displayed superposition, the maps of the ADP and rigor state were aligned, then the LPF MDFF models were rigid-body fit into the corresponding map. The extended lever arm model from each state was then superimposed on its corresponding LPF MDFF model based on common Cα coordinates. (E) A clash (red circle) between calmodulin (gray pipes and planks) and the MD (transparent purple surface) in the bent state lever arm (gray ribbon) would prevent it from adopting this conformation in the ADP state due to the orientation of the converter (purple ribbon). This analysis was conducted by superimposing the Cα coordinates of the converters (residues 706–773) of the extended-lever arm models shown in C. The converter and MD of the ADP model are displayed. (F) Schematic depicting myosin VI transition from ADP to rigor.
Figure 5—figure supplement 1.
Figure 5—figure supplement 1.. Converter modeling for ADP and rigor states.
(A) View of the LPF MDFF model for ADP (left, dark magenta) and rigor (right, light magenta) rigid-body fit into their corresponding segmented density maps (transparent grey) low-pass filtered to 7.5 Å, as described in Figure 3—figure supplement 1. An identical low-pass filter was applied to density maps shown in all following panels. (B) Two views of the boxed region indicated in panel A zoomed in on the converter and lever arm from the LPF ADP MDFF and LPF rigor MDFF models superimposed in the reference frame of the actin filament. To generate this superposition, the ADP and rigor density maps were aligned, then their full corresponding atomistic models were rigid body fit into the aligned maps. Only converter and lever arm regions shown for simplicity. Left: ADP density map (light grey), ADP converter and lever arm (dark magenta), rigor converter (yellow), rigor lever arm (grey). Right: Rigor density map (light grey), rigor converter and lever arm (magenta), ADP converter (yellow), ADP lever arm (grey). (C) Alignment of the low-pass filtered, segmented density maps for the ADP MD (dark magenta) and rigor MD (grey) aligned in the reference frame of the actin filament. To generate this alignment, the full ADP and rigor density maps were aligned, then the segmented maps were aligned to their corresponding full density maps.
Figure 5—figure supplement 2.
Figure 5—figure supplement 2.. EM density map comparison of ADP and rigor SH1 and relay helices.
View of the relay and SH1 helices of the LPF ADP MDFF model (left) and LPF rigor MDFF model (right) for ADP rigid-body fit into their corresponding density maps (transparent grey) low-pass filtered to 7.5 Å. Relay, yellow, SH1, red, cleft loop, dark magenta. Note winding of the SH1 and compaction of the relay upon transition into rigor.
Figure 5—figure supplement 3.
Figure 5—figure supplement 3.. Calmodulin interactions with myosin VI.
Calmodulin (grey) interactions with the myosin VI converter (pink) in the rigor-like X-ray structure (2BKI) in the reference frame of the actin filament (light grey).
Figure 6.
Figure 6.. Actin rearrangements accompany force generation.
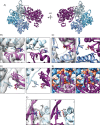
(A) Backbone averaged trace of the HR MDFF rigor interface consisting of 1 MD (magenta) and three actin subunits (shades of blue). (B) Actin hydrophobic plug repositioning between actin alone (blue), ADP (light grey), and rigor (grey). To generate the displayed superposition, the full ADP and rigor density maps were aligned to the actin alone density map, and then the back-bone averaged HR MDFF model of each state was rigid-body fit into its corresponding density map. (C) View of D-loop displacements coupled to H-plug motion, colored and aligned as in B. Region of myosin contacting the D-loop from the rigor structure is displayed in magenta for reference. (D) Per-residue Cα RMSD is displayed between superpositions of backbone-averaged HR MDFF models, aligned as described in B. The backbone of the first state indicated is displayed and colored. Rearrangements of the largest magnitude occur in the D-loop and H-plug. (E) Superpositions of all six inter-strand interfaces from the indicated HR MDFF atomistic models (not averaged) displaying the interaction between D-loop R39 on actin protomer one with H-plug E270 on protomer two and D286 in SD3 of protomer 3. The interfaces were superimposed based on the Cα coordinates of actin protomer 1 (dark-blue) subunits, as described in Figure 2A. Colors are as in A.
Figure 6—figure supplement 1.
Figure 6—figure supplement 1.. EM density map comparison of H-plug and D-loop rearrangements between actin alone, ADP, and Rigor.
View of the H-plug and D-loop of the averaged HR MDFF model for actin alone (left), ADP (middle) and rigor (right) rigid-body fit into their corresponding high-resolution density maps (actin: 5.5 Å, ADP 5.5 Å, rigor 4.6 Å). H-plug, red; D-loop, orange.
Figure 6—figure supplement 2.
Figure 6—figure supplement 2.. Differences in actin rearrangements between MyoVI and MyoIIC.
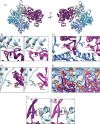
(A) Actin H-plug and D-loop repositioning between actin alone, ADP, and rigor. Same panels as Figure 6B and C. (B) Absence of H-plug repositioning between unbound actin alone (blue, PDB 5JLF) and myosin IIC rigor (grey, PDB 5JLH), left panel. To generate the displayed superposition, the full actin and rigor density maps were aligned, and then the model of each state was rigid-body fit into its corresponding density map. Region of myosin IIC contacting the D-loop from the rigor structure is displayed in light pink for reference. (C) Per-residue Cα RMSD is displayed between superpositions of backbone-averaged HR MDFF models of myosin VI (right) and myosin IIC structures (left), aligned as described in B. The backbone of the first state indicated is displayed and colored. Rearrangements occur in the D-loop for both motors; however, there are no accompanying H-plug rearrangements for myosin IIC.
Figure 7.
Figure 7.. Conceptual models summarizing implications of the ADP to rigor transition.
(A) Conservation of myosin VI between 47 organisms (left, Source Data 1) and among 18 human myosin isoforms (right, Source Data 2). Left, full MD; Right, en face view of actin binding interface with space-filling representation of critical residues mediating actin interaction. Actin density is displayed in transparent grey for reference. (B) Schematic of potential effects of force on the ADP to rigor transition. Due to the displacement associated with the lever arm bend, a rearward load should favor ADP engagement and a forward load should disfavor it. The displayed superposition was generated as in Figure 5D. (C) Cartoon depicting increased actin strain during myosin force generation. The MD (magenta) - D-loop (orange) interaction facilitates remodeling of the H-plug (red).
Author response image 1.
Author response image 1.. FSC curves for an unpublished reconstruction obtained from a 300 kV Titan Krios.
Reconstructions calculated utilizing both frames 2-60 (green), corresponding to a cumulative dose of ~80 electrons, as well as frames 2-10 (red), corresponding to a cumulative dose of ~16 electrons/Å2, resulted in nearly identical resolution assessments of 3.6-3.7 Å. The full-dose reconstruction has more signal across all resolution shells, suggesting incorporating signal from more frames improves the map.

Similar articles

Cited by

References

    1. Adams PD, Afonine PV, Bunkóczi G, Chen VB, Davis IW, Echols N, Headd JJ, Hung LW, Kapral GJ, Grosse-Kunstleve RW, McCoy AJ, Moriarty NW, Oeffner R, Read RJ, Richardson DC, Richardson JS, Terwilliger TC, Zwart PH. PHENIX: a comprehensive Python-based system for macromolecular structure solution. Acta Crystallographica Section D Biological Crystallography. 2010;66:213–221. doi: 10.1107/S0907444909052925. - DOI - PMC - PubMed
    1. Ahmed ZM, Morell RJ, Riazuddin S, Gropman A, Shaukat S, Ahmad MM, Mohiddin SA, Fananapazir L, Caruso RC, Husnain T, Khan SN, Riazuddin S, Griffith AJ, Friedman TB, Wilcox ER. Mutations of MYO6 are associated with recessive deafness, DFNB37. The American Journal of Human Genetics. 2003;72:1315–1322. doi: 10.1086/375122. - DOI - PMC - PubMed
    1. Altman D, Goswami D, Hasson T, Spudich JA, Mayor S. Precise positioning of myosin VI on endocytic vesicles in vivo. PLoS Biology. 2007;5:e210. doi: 10.1371/journal.pbio.0050210. - DOI - PMC - PubMed
    1. Altman D, Sweeney HL, Spudich JA. The mechanism of myosin VI translocation and its load-induced anchoring. Cell. 2004;116:737–749. doi: 10.1016/S0092-8674(04)00211-9. - DOI - PubMed
    1. Alushin GM, Lander GC, Kellogg EH, Zhang R, Baker D, Nogales E. High-resolution microtubule structures reveal the structural transitions in αβ-tubulin upon GTP hydrolysis. Cell. 2014;157:1117–1129. doi: 10.1016/j.cell.2014.03.053. - DOI - PMC - PubMed

Publication types

LinkOut - more resources