

Screening and identification of lncRNAs as potential biomarkers for pulmonary tuberculosis
- PMID: 29196714
- PMCID: PMC5711916
- DOI: 10.1038/s41598-017-17146-y
Screening and identification of lncRNAs as potential biomarkers for pulmonary tuberculosis
Abstract
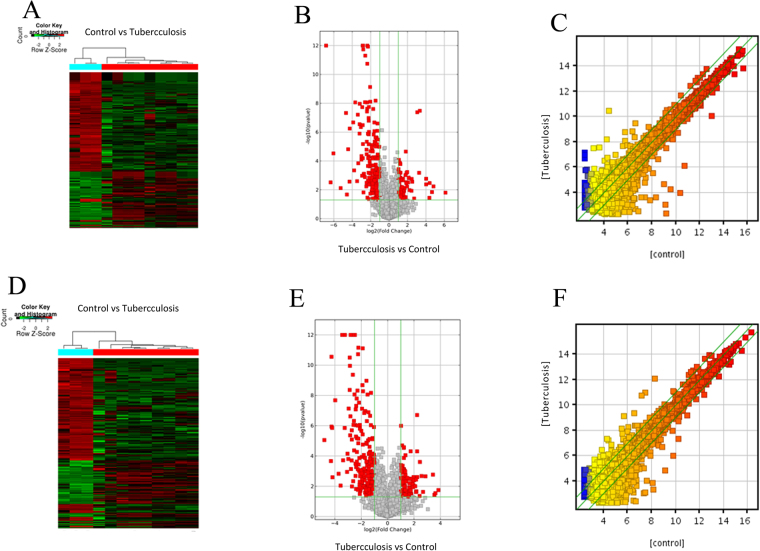
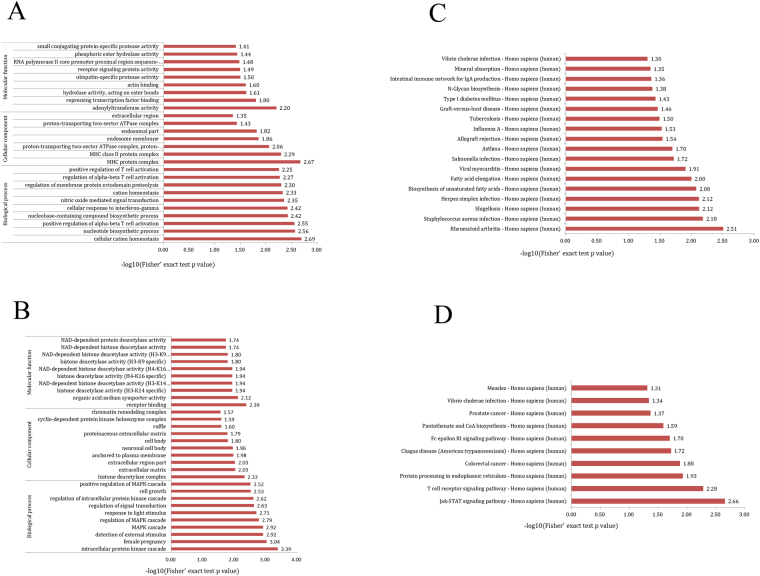
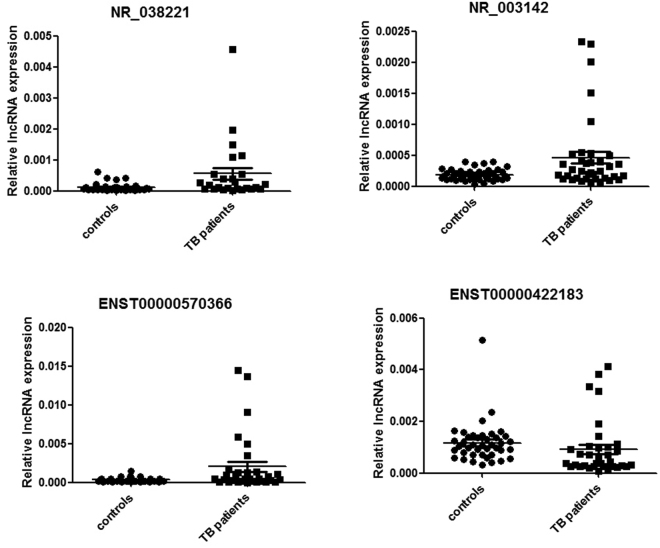
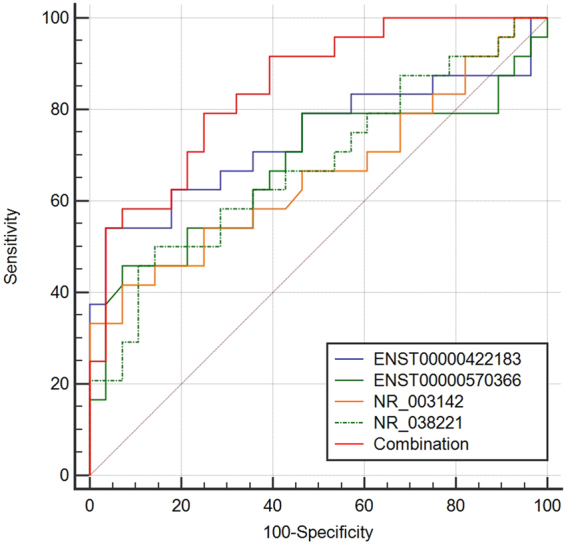
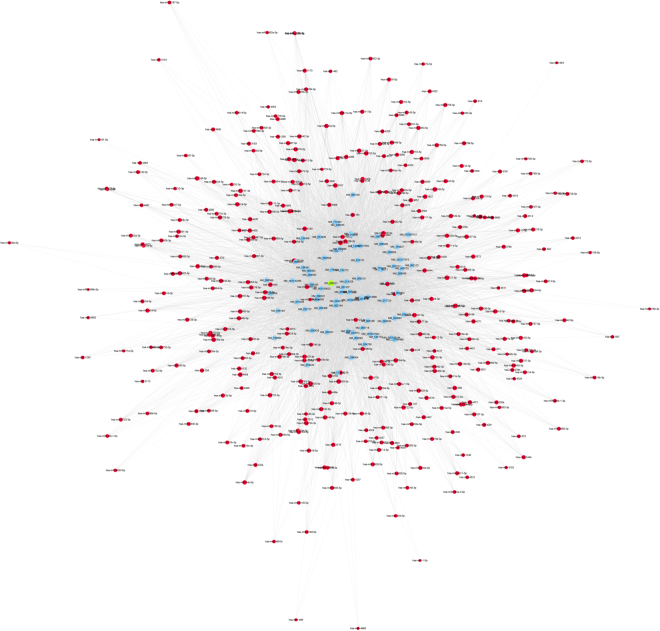
Pulmonary tuberculosis (TB) is among the diseases with the highest morbidity and mortality worldwide. Effective diagnostic methods for TB are lacking. In this study, we investigated long non-coding RNAs (lncRNAs) in plasma using microarray and the potential diagnostic value of lncRNAs for TB. We found a total of 163 up-regulated lncRNAs and 348 down-regulated lncRNAs. Gene ontology (GO), Kyoto Encyclopedia of Genes and Genomes (KEGG) and coding-noncoding co-expression (CNC) analyses showed that functions of differentially expressed lncRNAs were mainly enriched in the regulation of alpha-beta T cell activation and the T cell receptor signalling pathway. Four differentially expressed lncRNAs, NR_038221 (fold change = 3.79, P < 0.01), NR_003142 (fold change = 1.69, P < 0.05), ENST00000570366 (fold change = 3.04, P < 0.05), and ENST00000422183 (fold change = 2.11, P < 0.001), were verified using RT-qPCR. Among those, NR_038221, NR_003142, and ENST00000570366 were found to be up-regulated, while ENST00000422183 was down-regulated. The value of the area under the curve (AUC) for the diagnostic model consisting of the four lncRNAs was 0.845 (sensitivity = 79.2%, specificity = 75%). We further predicted 85 mRNAs and 404 miRNAs that potentially interact with these lncRNAs. Our study revealed the potential value of lncRNAs as biomarkers for early diagnosis of TB and the underlying mechanisms of these abnormally expressed lncRNAs in the pathogenesis of TB.
Conflict of interest statement
The authors declare that they have no competing interests.
Figures


Similar articles
-
Deregulated lncRNAs in B Cells from Patients with Active Tuberculosis.PLoS One. 2017 Jan 26;12(1):e0170712. doi: 10.1371/journal.pone.0170712. eCollection 2017. PLoS One. 2017. PMID: 28125665 Free PMC article.
-
Microarray expression profile analysis of mRNAs and long non-coding RNAs in pulmonary tuberculosis with different traditional Chinese medicine syndromes.BMC Complement Altern Med. 2016 Nov 17;16(1):472. doi: 10.1186/s12906-016-1436-y. BMC Complement Altern Med. 2016. PMID: 27855662 Free PMC article.
-
Integrative analysis of the contribution of mRNAs and long non‑coding RNAs to the pathogenesis of asthma.Mol Med Rep. 2019 Sep;20(3):2617-2624. doi: 10.3892/mmr.2019.10511. Epub 2019 Jul 19. Mol Med Rep. 2019. PMID: 31524265 Free PMC article.
-
Long non-coding RNA molecules in tuberculosis.Int J Biol Macromol. 2020 Aug 1;156:340-346. doi: 10.1016/j.ijbiomac.2020.04.030. Epub 2020 Apr 10. Int J Biol Macromol. 2020. PMID: 32283111 Review.
-
Dysregulated expression of long noncoding RNAs serves as diagnostic biomarkers of type 2 diabetes mellitus.Endocrine. 2019 Sep;65(3):494-503. doi: 10.1007/s12020-019-02015-7. Epub 2019 Jul 25. Endocrine. 2019. PMID: 31346922 Review.
Cited by
-
Identification and characterization of novel infection associated transcripts in macrophages.RNA Biol. 2021 Nov 12;18(sup2):604-611. doi: 10.1080/15476286.2021.1989217. Epub 2021 Nov 8. RNA Biol. 2021. PMID: 34747322 Free PMC article.
-
Functions of exosomal non-coding RNAs to the infection with Mycobacterium tuberculosis.Front Immunol. 2023 Mar 22;14:1127214. doi: 10.3389/fimmu.2023.1127214. eCollection 2023. Front Immunol. 2023. PMID: 37033928 Free PMC article. Review.
-
The Role of microRNAs and Long Non-Coding RNAs in the Regulation of the Immune Response to Mycobacterium tuberculosis Infection.Front Immunol. 2021 Jun 24;12:687962. doi: 10.3389/fimmu.2021.687962. eCollection 2021. Front Immunol. 2021. PMID: 34248974 Free PMC article. Review.
-
Construction of ceRNA regulatory networks for active pulmonary tuberculosis.Sci Rep. 2024 May 8;14(1):10595. doi: 10.1038/s41598-024-61451-2. Sci Rep. 2024. PMID: 38719908 Free PMC article.
-
Human genetics of mycobacterial disease.Mamm Genome. 2018 Aug;29(7-8):523-538. doi: 10.1007/s00335-018-9765-4. Epub 2018 Aug 16. Mamm Genome. 2018. PMID: 30116885 Free PMC article. Review.
References
-
- Organization, W. H. Global tuberculosis report 2016 (2016).
Publication types
MeSH terms
Substances
LinkOut - more resources
Full Text Sources
Other Literature Sources
