. 2017 Dec 19;47(6):1197-1209.e10.
doi: 10.1016/j.immuni.2017.11.007. Epub 2017 Nov 29.

Natural Parasite Exposure Induces Protective Human Anti-Malarial Antibodies

Affiliations

Natural Parasite Exposure Induces Protective Human Anti-Malarial Antibodies

Gianna Triller et al. Immunity. .

Abstract

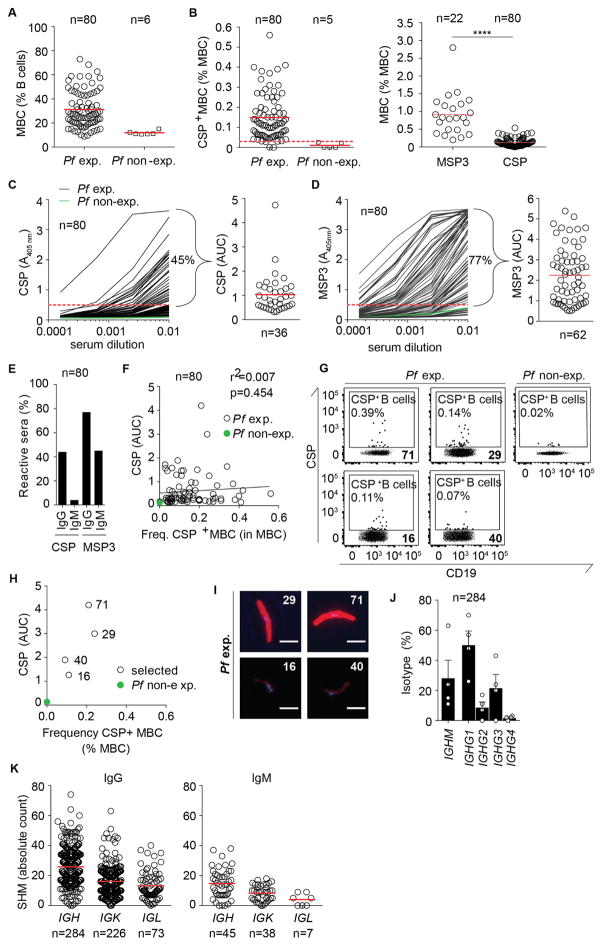
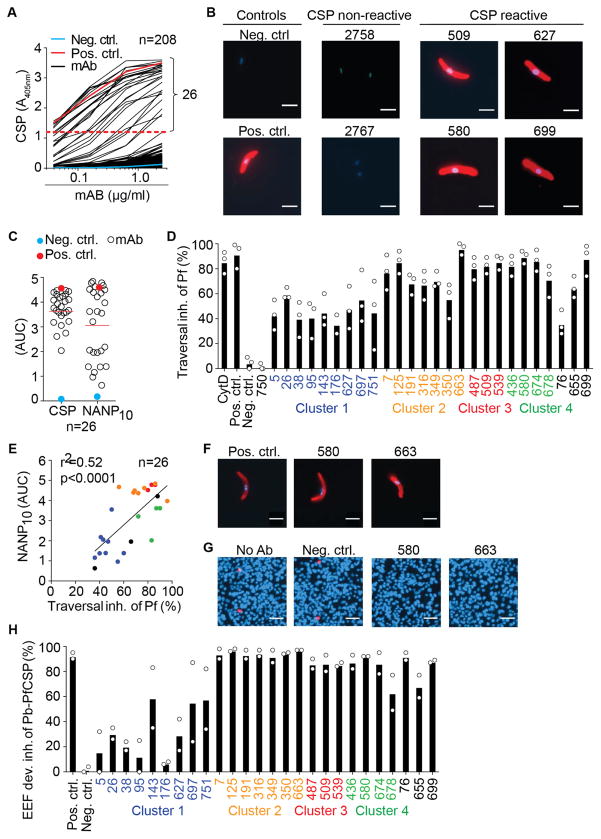
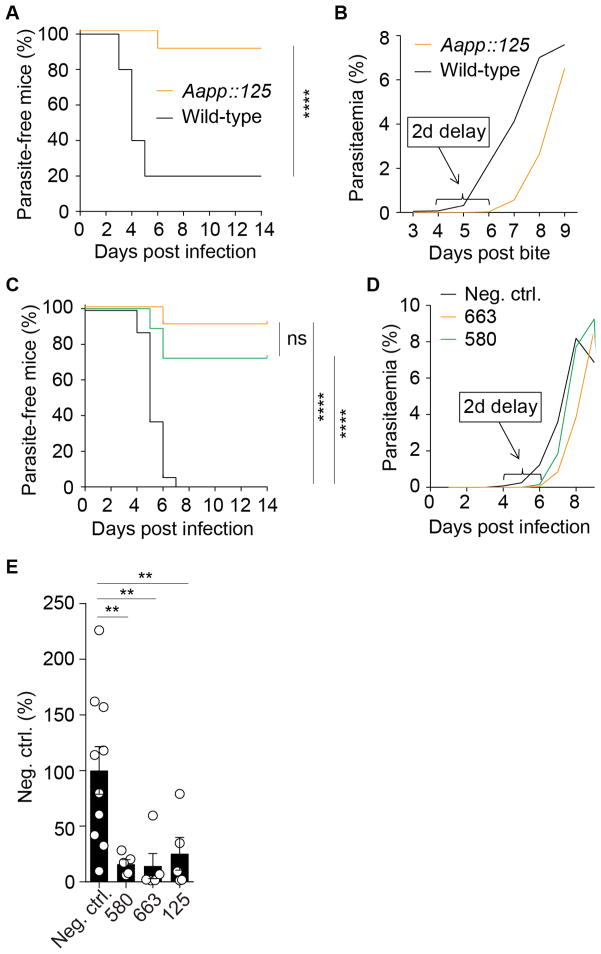
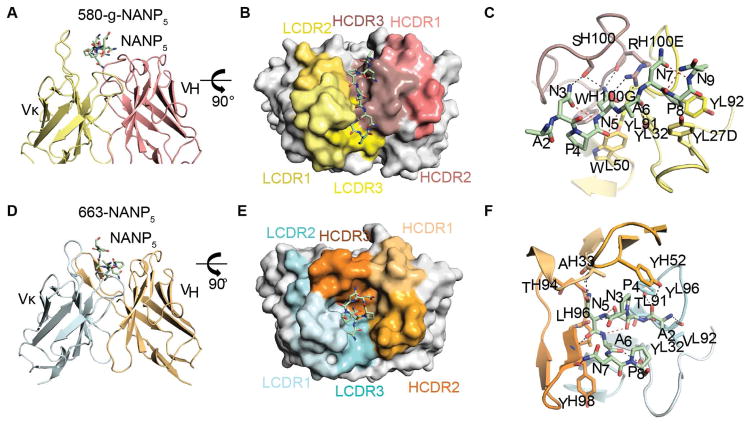
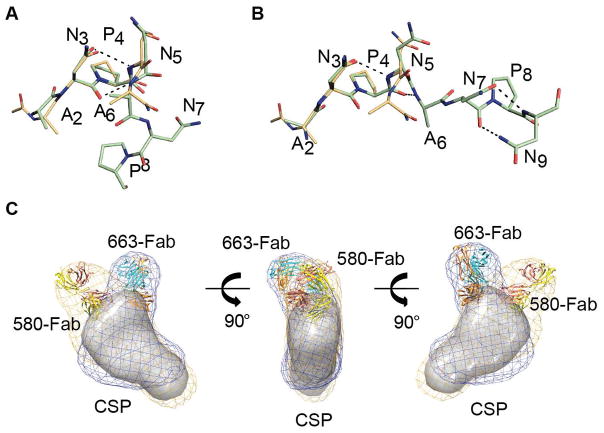
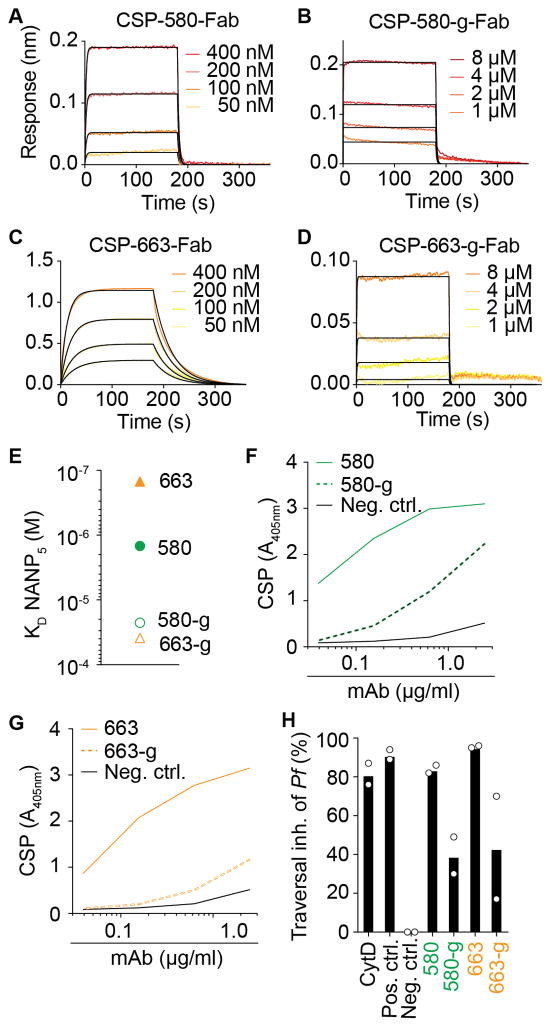
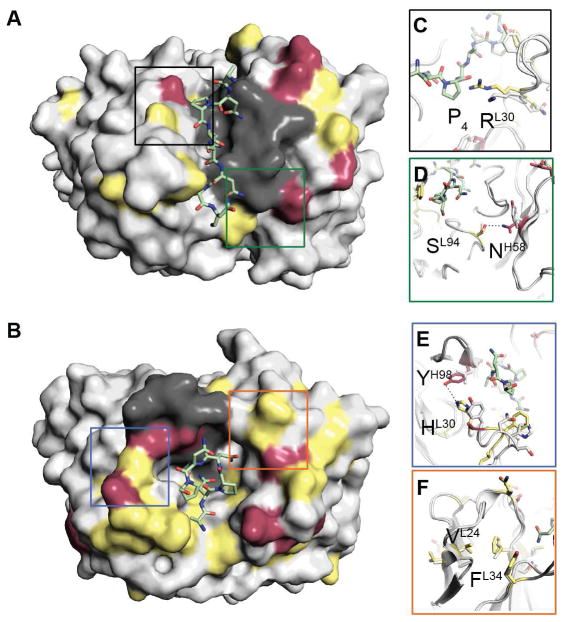
Antibodies against the NANP repeat of circumsporozoite protein (CSP), the major surface antigen of Plasmodium falciparum (Pf) sporozoites, can protect from malaria in animal models but protective humoral immunity is difficult to induce in humans. Here we cloned and characterized rare affinity-matured human NANP-reactive memory B cell antibodies elicited by natural Pf exposure that potently inhibited parasite transmission and development in vivo. We unveiled the molecular details of antibody binding to two distinct protective epitopes within the NANP repeat. NANP repeat recognition was largely mediated by germline encoded and immunoglobulin (Ig) heavy-chain complementarity determining region 3 (HCDR3) residues, whereas affinity maturation contributed predominantly to stabilizing the antigen-binding site conformation. Combined, our findings illustrate the power of exploring human anti-CSP antibody responses to develop tools for malaria control in the mammalian and the mosquito vector and provide a molecular basis for the structure-based design of next-generation CSP malaria vaccines.

Keywords: Plasmodium falciparum; X-ray structures; affinity maturation; circumsporozoite protein; epitope specificity; human; malaria; memory B cells; natural infection; protective antibodies.


Figures

Figure 1
Figure 1. Characterization of anti-CSP memory B cells (MBCs)
(A) Frequency of peripheral blood MBCs in healthy Pf exposed (Pf exp.) African and in non-exposed (Pf non-exp.) European donors as determined by flow cytometry. (B) Frequency of CSP-reactive MBCs in the same samples as in (A) (left). Frequency of MSP3-reactive MBCs in a representative subset of samples compared to the frequency of CSP-reactive MBCs after normalization to the respective non-exposed European donors (right). (C) Representative anti-CSP IgG ELISA (left) for sera from the same Pf exposed donors (left, black lines) and one non-exposed donor (left, green line) as in (A) and corresponding area under curve (AUC) values for positive sera (right). Percentage of CSP-reactive sera is indicated. (D) Representative anti-MSP3 IgG ELISA (left) and corresponding AUC values for anti-MSP3 IgG positive sera (right) for the same donors as in (C). Percentage of positive sera is indicated. (E) Percentage of anti-CSP and anti-MSP3 IgG or IgM positive sera from Pf exposed donors identified in (C and D). (F) Linear regression between percentage of CSP-reactive MBCs (B) and anti-CSP serum IgG ELISA AUC (C) from Pf exposed donors (open circles) and one representative non-exposed control (green circle). Cell frequencies for the gated populations are indicated. (G) Sort gates for CSP-reactive B cells in four Pf exp. and one non-exp. donor after pre-gating as in S1A. Cell frequencies are indicated. Bold numbers indicate donor IDs. (H) Correlation between the frequency of CSP-reactive MBCs (B) and anti-CSP IgG ELISA reactivity (AUC) (C) for the same donors as in (G). (I) Representative serum IgG immunofluorescence reactivity (red) with Pf sporozoites and DAPI-stained Pf sporozoite nuclei (blue) (bars, 5 μm) for the same donors as in (G and H). (J) Mean IGHM and IGHG1-4 isotype distribution in the same donors as in G–I (circles) and for all donors pooled (bars). Error bars show SD. (K) IGHV, IGKV and IGLV SHM base pair counts for all donors pooled. n indicates the number of donors (A, B and F) and the number of tested sera (C–E), or the number of Ig gene sequences (J and K) that were analyzed. Solid red lines in (A–D and K) show arithmetic means. Dashed lines in (B–D) depict threshold for CSP and MSP3 reactivity. Data are representative of two (A, B, G and I) or three independent experiments (C and D). Data in (B) were analyzed using Mann-Whitney test, ****p < 0.0001. See also Table S1.
Figure 2
Figure 2. Functional in vitro characterization of CSP-reactive MBC antibodies
(A) Representative CSP-ELISA reactivity of recombinant monoclonal antibodies (mAB) (black lines) and positive (pos. ctrl., red line) and negative (neg. ctrl., blue line) controls. Dashed red line depicts threshold for CSP reactivity. (B) Representative mAB immunofluorescence reactivity (red) with Pf sporozoites and DAPI-stained Pf sporozoite nuclei (blue) (bars, 5 μm). (C) ELISA AUC values for CSP and NANP10 reactivity of CSP-reactive mAB. Solid red line shows arithmetic means. (D) Pf hepatocyte traversal inhibition (inh.) by recombinant MBC mAB and controls. (E) Pf hepatocyte traversal inhibition (inh.) versus NANP10 ELISA AUC reactivity. (F) Representative anti-CSP immunofluorescence reactivity (red) and DAPI-stained Pb-PfCSP sporozoite nuclei (blue) (bars, 5 μm). (G) Representative microscopy pictures of Pb-PfCSP EEF cultures. (H) Inhibition of Pb-PfCSP EEF development (dev.) by recombinant MBC mAB and controls. n in (A, C and E) indicates absolute number of tested mAB. Bars in (D and H) depict mean of three independent experiments, white circles represent mean of two technical replicates in independent experiments. Positive control antibody, Cytochalasin D (CytD) and negative control are shown. Colored labels in (D, E, H) indicate clonally related antibodies from the indicated MBC clusters, non-cluster antibodies are labeled in black. Data in (A and C) and in (B, F, G and H) are representative of three and two independent experiments, respectively. See also Figures S1 and S2 and Table S2.
Figure 3
Figure 3. In vivo parasite inhibitory activity of CSP-reactive MBC antibodies
(A) Parasite-free mice after exposure to bites of Pb-PfCSP-infected wild-type (black line) or Aapp::125 mosquitoes (orange line) (n = 10 per group). (B) Mean parasitaemia in infected mice after exposure to bites of Pb-PfCSP-infected wild-type or Aapp::125 mosquitoes as in (A). (C) Parasite-free mice after passive immunization with the indicated antibodies before s.c. infection with Pb-PfCSP sporozoites (580, green, n = 6; 663, orange, n = 7; negative control, black, n = 5 individual mice for every experiment). (D) Mean parasitaemia in infected mice after passive immunization with the indicated antibodies before s.c. infection with Pb-PfCSP sporozoites as in (C). (E) Bioluminescence analysis of FRG-huHep mice challenged with bites from 50 PfGFP-luc sporozoites-infected mosquitoes after passive immunization with the indicated antibodies (580, n = 5; 663, n = 5; negative control, n = 10 individual mice; circle, one mouse; bar, mean ± SEM). Parasite burden was determined after normalization to the mGO53 control group. 1-way ANOVA with Kruskal-Wallis **p < 0.001, F(4, 25) = 6.456. Data in (A and B) are from three independent experiments and were analyzed using Log-rank Mantel-Cox test, ****p < 0.0001. See also Figure S3.
Figure 4
Figure 4. Crystal structure and interaction of NANP5 in complex with 580-germline (g)-Fab and 663-Fab
(A) Cartoon representation of the 580-g Fab variable region. The 580-g L- and H-chains are colored in yellow and salmon, respectively. NANP5 peptide is shown as green sticks. (B) Surface representation of the 580-g paratope. The 580-g LCDR1, 2 and 3 regions are colored in shades of yellow. The 580-g HCDR1, 2 and 3 regions are colored in shades of salmon. (C) Cartoon representation of the 580-g Fab variable region. Antibody residues that make H-bond contacts or form an aromatic cage surrounding prolines in the NANP5 epitope are represented as sticks. Inter-chain H-bonds between the NANP5 and the 580-g-Fab are shown as black dashes, while intra-chain H-bonds are shown as red dashes. (D) Cartoon representation of the 663 Fab variable region. The 663 L- and H-chains are colored in cyan and orange, respectively. NANP5 peptide is shown as green sticks. (E) Surface representation of the 663 paratope. The 663 LCDR1, 2 and 3 regions are colored in shades of cyan. The 663 HCDR1, 2 and 3 regions are colored in shades of orange. (F) Cartoon representation of the 663 Fab variable region. Antibody residues that provide H-bond contacts or form an aromatic cage surrounding prolines in the NANP5 epitope are represented as sticks. Inter-chain H-bonds between the NANP5 and the 663-Fab are shown as black dashes, while intra-chain H-bonds are shown as red dashes. See also Figure S4 and Tables S3–S5.
Figure 5
Figure 5. NANP repeat epitope structures and antibody binding to full-length CSP
(A) Superposition of the 663 bound NANP5 peptides with the previously described crystal structure of an ANPNA peptide colored in orange (Ghasparian et al., 2006). Intra-chain H-bonds are represented as black dashes. (B) Superposition of the 580-g bound NANP5 peptides with the previously described crystal structure of an ANPNA peptide colored in orange (Ghasparian et al., 2006). Intra-chain H-bonds are represented as black dashes. (C) The 663-Fab and 580-g-Fab crystal structures docked into a SAXS envelope of 580-Fab-CSP and 663-Fab-CSP co-complexes. CSP alone is shown as surface and colored grey. See also Figure S5 and Tables S6 and S7.
Figure 6
Figure 6. Functional comparison of affinity-matured 580 and 663 antibodies to their germline reverted ancestors 580-g and 663-g
(A) Representative sensograms (red and orange) and 1:1 model best fits (black) for CSP binding of the 580 Fab. (B) Representative sensograms (red and orange) and 1:1 model best fits (black) for CSP binding of the 580-g Fab. (C) Representative sensograms (red and orange) and 1:1 model best fits (black) for CSP binding of the 663 Fab. (D) Representative sensograms (red and orange) and 1:1 model best fits (black) for CSP binding of the 663-g Fab. (E) SPR against NANP5 for the mutated (filled symbols) and germline (open symbols) versions of antibody 580 (circles) and 663 (triangles). (F) CSP ELISA of the mutated (solid green line) and germline (dashed green line) versions of antibody 580. (G) CSP ELISA of the mutated (solid orange line) and germline (dashed orange line) versions of antibody 663. (H) Pf hepatocyte traversal inhibition (inh.) of the indicated antibodies. Data are from two independent experiments. Bars depict mean of two independent experiments, white circles represent mean of two technical replicates in independent experiments. Positive control antibody, Cytochalasin D (CytD) and negative control are shown. Data in (A–E) and (F and G) are representative of two and three independent experiments, respectively. Black solid lines in (F and G) represent the negative control antibody. See also Table S7.
Figure 7
Figure 7. Structural comparison of affinity-matured 580 and 663 antibodies to their germline reverted ancestors 580-g and 663-g
(A) Surface representation of the 580-g-NANP5 crystal structure. Antibody residues are colored according to identity between the germline reverted ancestors and affinity matured antibodies. Identical, similar and different residues are colored in grey, yellow and maroon, respectively. Unchanged HCDR3 residues are colored in dark grey. (B) Surface representation of the 663-NANP5 crystal structure. Antibody residues are color-coded as in (A). (C) Mutation in 580 that leads to additional contacts between Fab and peptide. (D) Mutations in 580 that lead to stabilization of the paratope. (E–F) Mutations in 663 that lead to stabilization of the paratope. See also Figure S6.

Similar articles

Cited by

References

    1. Adams PD, Afonine PV, Bunkóczi G, Chen VB, Davis IW, Echols N, Headd JJ, Hung LW, Kapral GJ, Grosse-Kunstleve RW, et al. PHENIX: a comprehensive Python-based system for macromolecular structure solution. Acta Crystallogr Sect D Biol Crystallogr. 2010;66:213–221. - PMC - PubMed
    1. Aikawa M, Yoshida N, Nussenzweig RS, Nussenzweig V. The Protective Antigen of Malarial Sporozoites (Plasmodium berghei) Is a Differentiation Antigen. J Immunol. 1981;126:2494–2495. - PubMed
    1. Aricescu AR, Lu W, Jones EY. A time- and cost-efficient system for high-level protein production in mammalian cells. Acta Crystallogr Sect D Biol Crystallogr. 2006;62:1243–1250. - PubMed
    1. Baker NA, Sept D, Joseph S, Holst MJ, McCammon JA. Electrostatics of nanosystems: application to microtubules and the ribosome. Proc Natl Acad Sci U S A. 2001;98:10037–10041. - PMC - PubMed
    1. Behet MC, Foquet L, van Gemert GJ, Bijker EM, Meuleman P, Leroux-Roels G, Hermsen CC, Scholzen A, Sauerwein RW. Sporozoite immunization of human volunteers under chemoprophylaxis induces functional antibodies against pre-erythrocytic stages of Plasmodium falciparum. Malar J. 2014;13:1–12. - PMC - PubMed

Publication types

MeSH terms