Comprehensive high-throughput image analysis for therapeutic efficacy of architecturally complex heterotypic organoids
- PMID: 29192263
- PMCID: PMC5709388
- DOI: 10.1038/s41598-017-16622-9
Comprehensive high-throughput image analysis for therapeutic efficacy of architecturally complex heterotypic organoids
Abstract
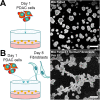
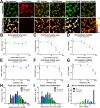
Bioengineered three-dimensional (3D) tumor models that incorporate heterotypic cellular communication are gaining interest as they can recapitulate key features regarding the intrinsic heterogeneity of cancer tissues. However, the architectural complexity and heterogeneous contents associated with these models pose a challenge for toxicological assays to accurately report treatment outcomes. To address this issue, we describe a comprehensive image analysis procedure for structurally complex organotypic cultures (CALYPSO) applied to fluorescence-based assays to extract multiparametric readouts of treatment effects for heterotypic tumor cultures that enables advanced analyses. The capacity of this approach is exemplified on various 3D models including adherent/suspension, mono-/heterocellular cultures and several disease types. The subsequent analysis revealed specific morphological effects of oxaliplatin chemotherapy, radiotherapy, and photodynamic therapy. The procedure can be readily implemented in most laboratories to facilitate high-throughput toxicological screening of pharmaceutical agents and treatment regimens on organotypic cultures of human disease to expedite drug and therapy development.
Conflict of interest statement
The authors declare that they have no competing interests.
Figures


Similar articles
-
Analysis of Treatment Effects on Structurally Complex Microtumor Cultures Using a Comprehensive Image Analysis Procedure.Methods Mol Biol. 2022;2451:59-70. doi: 10.1007/978-1-0716-2099-1_5. Methods Mol Biol. 2022. PMID: 35505010
-
Circulating tumor cell-derived organoids: Current challenges and promises in medical research and precision medicine.Biochim Biophys Acta Rev Cancer. 2018 Apr;1869(2):117-127. doi: 10.1016/j.bbcan.2017.12.005. Epub 2018 Jan 31. Biochim Biophys Acta Rev Cancer. 2018. PMID: 29360544 Free PMC article. Review.
-
Quantitative Phenotypic Image Analysis of Three-Dimensional Organotypic Cultures.Methods Mol Biol. 2017;1612:433-445. doi: 10.1007/978-1-4939-7021-6_31. Methods Mol Biol. 2017. PMID: 28634961
-
Protocol for generation of and high-throughput drug testing with patient-derived colorectal cancer organoids.STAR Protoc. 2024 Jun 21;5(2):103090. doi: 10.1016/j.xpro.2024.103090. Epub 2024 May 28. STAR Protoc. 2024. PMID: 38809757 Free PMC article.
-
Organoids as Models for Neoplastic Transformation.Annu Rev Pathol. 2016 May 23;11:199-220. doi: 10.1146/annurev-pathol-012615-044249. Epub 2016 Feb 22. Annu Rev Pathol. 2016. PMID: 26907527 Review.
Cited by
-
Low dose photodynamic therapy harmonizes with radiation therapy to induce beneficial effects on pancreatic heterocellular spheroids.Oncotarget. 2019 Apr 5;10(27):2625-2643. doi: 10.18632/oncotarget.26780. eCollection 2019 Apr 5. Oncotarget. 2019. PMID: 31080554 Free PMC article.
-
Radiation Dose-Enhancement Is a Potent Radiotherapeutic Effect of Rare-Earth Composite Nanoscintillators in Preclinical Models of Glioblastoma.Adv Sci (Weinh). 2020 Sep 7;7(20):2001675. doi: 10.1002/advs.202001675. eCollection 2020 Oct. Adv Sci (Weinh). 2020. PMID: 33101867 Free PMC article.
-
Generating Large Numbers of Pancreatic Microtumors on Alginate-Gelatin Hydrogels for Quantitative Imaging of Tumor Growth and Photodynamic Therapy Optimization.Methods Mol Biol. 2022;2451:91-105. doi: 10.1007/978-1-0716-2099-1_8. Methods Mol Biol. 2022. PMID: 35505013
-
Methods in cancer research: Assessing therapy response of spheroid cultures by life cell imaging using a cost-effective live-dead staining protocol.Biol Methods Protoc. 2024 Aug 22;9(1):bpae060. doi: 10.1093/biomethods/bpae060. eCollection 2024. Biol Methods Protoc. 2024. PMID: 39234439 Free PMC article.
-
Automated spheroid generation, drug application and efficacy screening using a deep learning classification: a feasibility study.Sci Rep. 2020 Jul 6;10(1):11071. doi: 10.1038/s41598-020-67960-0. Sci Rep. 2020. PMID: 32632214 Free PMC article.
References
-
- Yap, T. A., Gerlinger, M., Futreal, P. A., Pusztai, L. & Swanton, C. Intratumor Heterogeneity: Seeing the Wood for the Trees. Sci. Transl. Med. 4 (2012). - PubMed
Publication types
MeSH terms
Substances
Grants and funding
LinkOut - more resources
Full Text Sources
Other Literature Sources

