Small Gold Nanorods: Recent Advances in Synthesis, Biological Imaging, and Cancer Therapy
- PMID: 29189739
- PMCID: PMC5744307
- DOI: 10.3390/ma10121372
Small Gold Nanorods: Recent Advances in Synthesis, Biological Imaging, and Cancer Therapy
Abstract
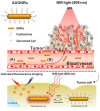
Over the past few decades, the synthetic development of ultra-small nanoparticles has become an important strategy in nano-medicine, where smaller-sized nanoparticles are known to be more easily excreted from the body, greatly reducing the risk caused by introducing nano-theranostic agents. Gold nanorods are one of the most important nano-theranostic agents because of their special optical and electronic properties. However, the large size (diameter > 6 nm) of most obtained gold nanorods limits their clinical application. In recent years, more and more researchers have begun to investigate the synthesis and application of small gold nanorods (diameter < 6 nm), which exhibit similar optical and electronic properties as larger gold nanorods. In this review, we summarize the recent advances of synthesis of the small gold nanorods and their application for near-infrared light-mediated bio-imaging and cancer therapy.
Keywords: biological imaging; cancer therapy; seedless; small gold nanorods.
Conflict of interest statement
The authors declare no conflict of interest.
Figures


Similar articles
-
Synthesis and optical properties of small Au nanorods using a seedless growth technique.Langmuir. 2012 Jun 26;28(25):9807-15. doi: 10.1021/la301387p. Epub 2012 Jun 11. Langmuir. 2012. PMID: 22620850
-
Concentration effect on large scale synthesis of high quality small gold nanorods and their potential role in cancer theranostics.Mater Sci Eng C Mater Biol Appl. 2018 Jun 1;87:120-127. doi: 10.1016/j.msec.2018.02.021. Epub 2018 Feb 28. Mater Sci Eng C Mater Biol Appl. 2018. PMID: 29549941
-
Calculated absorption and scattering properties of gold nanoparticles of different size, shape, and composition: applications in biological imaging and biomedicine.J Phys Chem B. 2006 Apr 13;110(14):7238-48. doi: 10.1021/jp057170o. J Phys Chem B. 2006. PMID: 16599493
-
Gold nanoparticles and gold nanorods in the landscape of cancer therapy.Mol Cancer. 2023 Jun 21;22(1):98. doi: 10.1186/s12943-023-01798-8. Mol Cancer. 2023. PMID: 37344887 Free PMC article. Review.
-
Gold Nanorods for Drug and Gene Delivery: An Overview of Recent Advancements.Pharmaceutics. 2022 Mar 17;14(3):664. doi: 10.3390/pharmaceutics14030664. Pharmaceutics. 2022. PMID: 35336038 Free PMC article. Review.
Cited by
-
Multifunctional gold nanoparticles for osteoporosis: synthesis, mechanism and therapeutic applications.J Transl Med. 2023 Dec 7;21(1):889. doi: 10.1186/s12967-023-04594-6. J Transl Med. 2023. PMID: 38062495 Free PMC article. Review.
-
Engineered Gold-Based Nanomaterials: Morphologies and Functionalities in Biomedical Applications. A Mini Review.Bioengineering (Basel). 2019 Jun 10;6(2):53. doi: 10.3390/bioengineering6020053. Bioengineering (Basel). 2019. PMID: 31185667 Free PMC article. Review.
-
Radiolabeled Gold Nanoparticles for Imaging and Therapy of Cancer.Materials (Basel). 2020 Dec 22;14(1):4. doi: 10.3390/ma14010004. Materials (Basel). 2020. PMID: 33375074 Free PMC article. Review.
-
Synthesis of doxorubicin-loaded peptosomes hybridized with gold nanorod for targeted drug delivery and CT imaging of metastatic breast cancer.J Nanobiotechnology. 2022 Aug 31;20(1):391. doi: 10.1186/s12951-022-01607-2. J Nanobiotechnology. 2022. PMID: 36045404 Free PMC article.
-
A review of recent advances in the use of complex metal nanostructures for biomedical applications from diagnosis to treatment.Wiley Interdiscip Rev Nanomed Nanobiotechnol. 2024 May-Jun;16(3):e1959. doi: 10.1002/wnan.1959. Wiley Interdiscip Rev Nanomed Nanobiotechnol. 2024. PMID: 38711134 Review.
References
Publication types
LinkOut - more resources
Full Text Sources
Other Literature Sources
Miscellaneous

