. 2017 Nov 24;8(1):1775.
doi: 10.1038/s41467-017-01854-0.

An activity-dependent proximity ligation platform for spatially resolved quantification of active enzymes in single cells

Affiliations

An activity-dependent proximity ligation platform for spatially resolved quantification of active enzymes in single cells

Gang Li et al. Nat Commun. .

Abstract

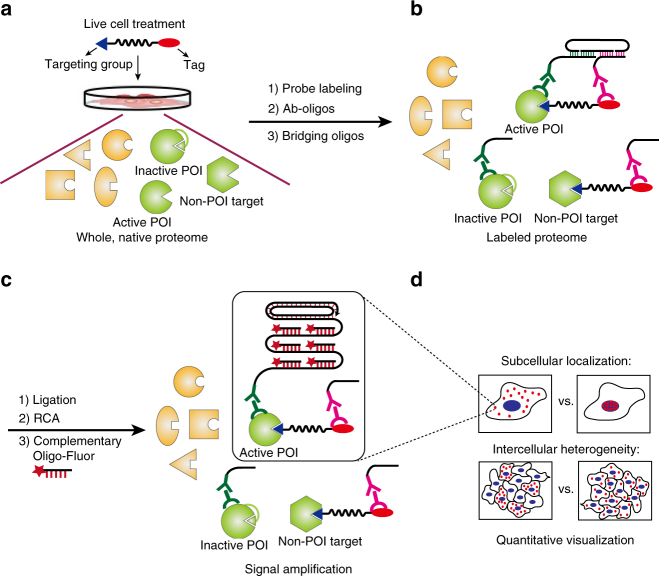
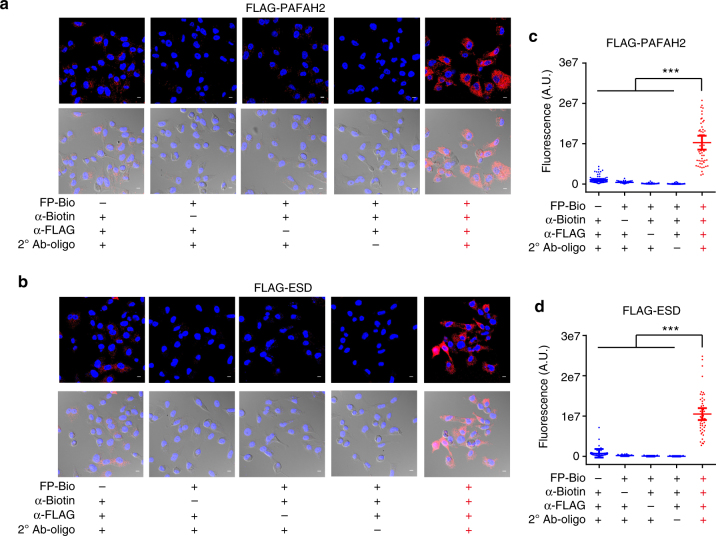
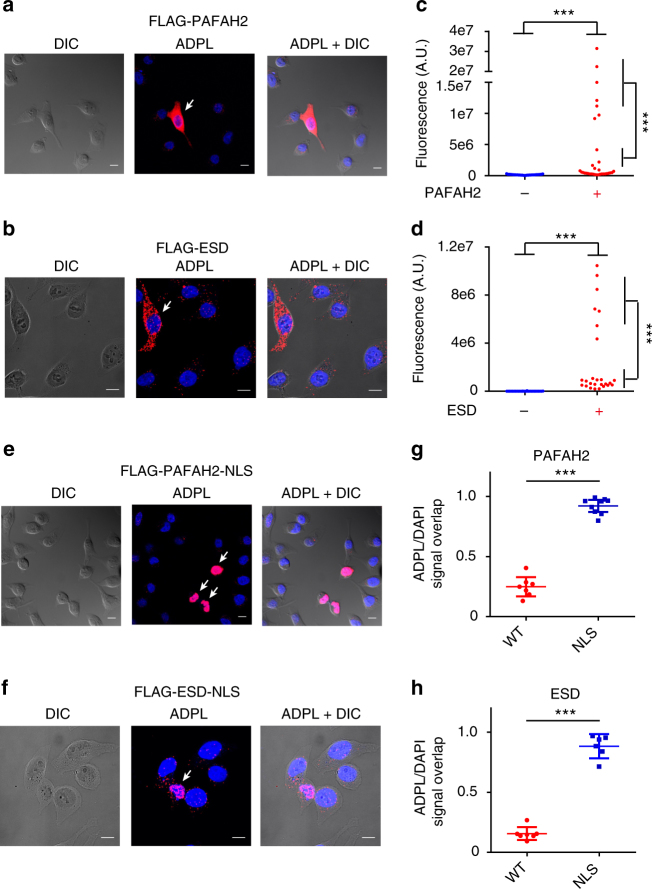
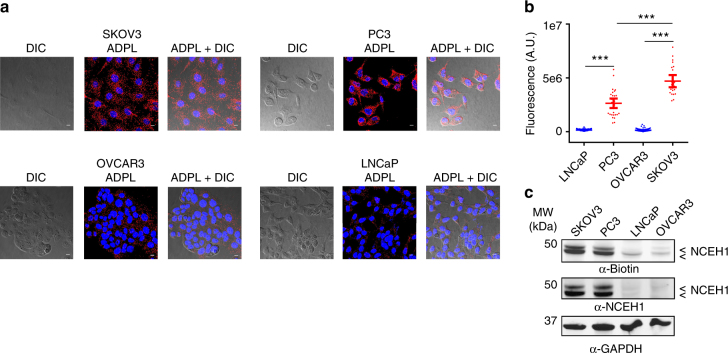
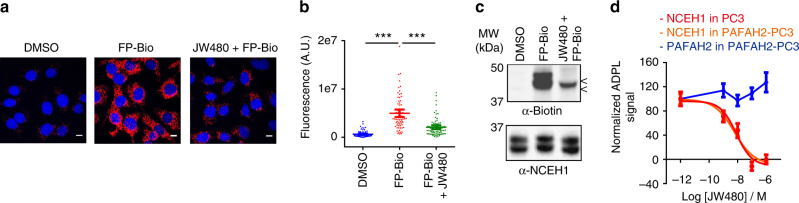
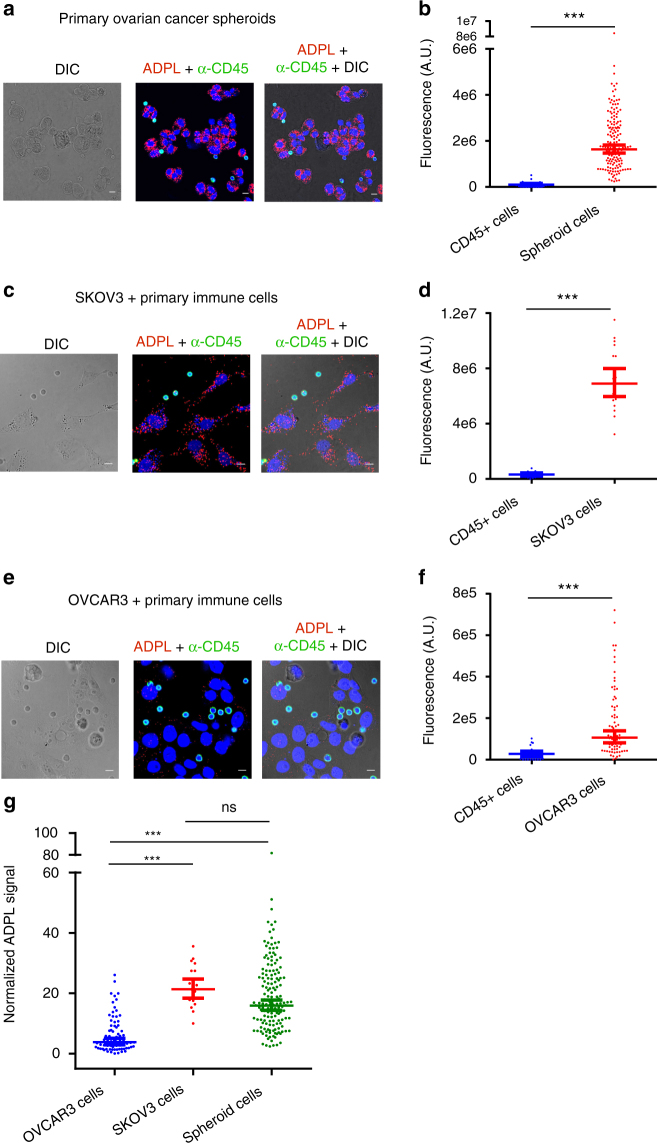
Integration of chemical probes into proteomic workflows enables the interrogation of protein activity, rather than abundance. Current methods limit the biological contexts that can be addressed due to sample homogenization, signal-averaging, and bias toward abundant proteins. Here we report a platform that integrates family-wide chemical probes with proximity-dependent oligonucleotide amplification and imaging to quantify enzyme activity in native contexts with high spatial resolution. Application of this method, activity-dependent proximity ligation (ADPL), to serine hydrolase and cysteine protease enzymes enables quantification of differential enzyme activity resulting from endogenous changes in localization and expression. In a competitive format, small-molecule target engagement with endogenous proteins in live cells can be quantified. Finally, retention of sample architecture enables interrogation of complex environments such as cellular co-culture and patient samples. ADPL should be amenable to diverse probe and protein families to detect active enzymes at scale and resolution out of reach with current methods.


Conflict of interest statement

The authors declare no competing financial interests.

Figures

Fig. 1
Fig. 1
Schematic depicting the activity-dependent proximity ligation (ADPL) workflow. a Live cells pulsed with a family-wide chemical probe labels active proteins within their native environment. b Detection of probe-labeled protein-of-interest (POI) is accomplished by incubation of fixed cells with primary antibodies directed to the POI, and probe detection handle (biotin). Subsequent incubation with secondary antibody-oligonucleotide conjugates directed against each primary antibody enables hybridization and ligation of two bridging complementary oligonucleotides only when the probe and POI are in high proximity (i.e., on the same protein). c Signal amplification and detection is achieved through ligation, rolling circle amplification, and subsequent hybridization of fluorophore-conjugated complementary oligonucleotides. d Visualization and quantification of sub-cellular and intercellular enzyme activity is afforded by fluorescence microscopy
Fig. 2
Fig. 2
Modular, specific detection of active serine hydrolases by ADPL imaging. a, b Representative ADPL detection and visualization of active FLAG-PAFAH2 (a) and FLAG-ESD (b) in PC3 cells in the presence or absence of the indicated ADPL components. Channels shown are DAPI nuclear stain (blue), ADPL signal (red), and overlayed signal on light field images. c, d Quantified single-cell ADPL fluorescent signal from active FLAG-PAFAH2 (c) and FLAG-ESD (d) in the presence or absence of indicated ADPL components, demonstrating the probe- and POI-dependent nature of a robust ADPL signal. Quantification of signal in c: minus FP-Bio (n = 76), minus α-biotin (n = 73), minus α-FLAG (n = 89), minus 2° antibody-oligo (n = 87), positive ADPL (n = 53). Quantification in d: minus FP-Bio (n = 64), minus α-biotin (n = 68), minus α-FLAG (n = 63), minus 2° antibody-oligo (n = 63), positive ADPL (n = 50). Unpaired t-test results in c, d are between individual ADPL conditions in the absence of one component and the positive ADPL condition containing all components. ***P < 0.001, Student’s t test. Representative images are from triplicate technical replicates of two or more independent biological experiments. Each dot represents a single-cell fluorescence measurement, center line and whiskers denote the mean and 95% C.I. of the population, respectively. Scale bars = 10 μm
Fig. 3
Fig. 3
ADPL imaging detects intercellular and intracellular localization of active enzymes. a, b Representative ADPL images of HeLa cells transiently transfected with FLAG-PAFAH2 (a) or FLAG-ESD (b); representative outlier cells exhibiting strong ADPL signal and used for quantification of positive cells are denoted by white arrows. c, d Quantified single-cell ADPL fluorescent signals from representative fields of non-transfected cells and the entire population of cells transfected with FLAG-PAFAH2 (c) and FLAG-ESD (d). Statistical evaluations shown are comparing mean ADPL signal from positive, transfected cells to the entire field of non-transfected cells (top comparison in both c, d) and negative cells within the same experiment (right in c, d). Quantification of signal in c: negative transfection (n = 31), positive transfection (n = 33). Quantification of signal in d: negative transfection (n = 28), positive transfection (n = 26). Denoted “n” values indicate total number of cells in each analysis group. e, f Representative ADPL images of HeLa cells transiently transfected with hydrolases tagged with a nuclear localization sequences: NLS-PAFAH2 (e) and NLS-ESD (f); representative outlier cells exhibiting strong ADPL signal and used for quantification of positive cells are denoted by white arrows. g, h Quantification of the ADPL/DAPI fluorescence signal overlay in positive cells, which is a representation of nuclear localization. WT wild-type FLAG-PAFAH2 or FLAG-ESD transfection, as shown in a, b, respectively. NLS NLS-PAFAH2 or NLS-ESD transfection, as shown in e, f, respectively. Quantification of signal in e: WT (n = 7), NLS (n = 9). Quantification of signal in f: WT (n = 7), NLS (n = 6). Scale bars = 10 μm in all images. Blue channel: DAPI nuclear; red channel: ADPL signal; gray channel: DIC. ***P < 0.001, Student’s t test. Each dot represents a single-cell fluorescence measurement, center line and whiskers denote the mean and 95% C.I. of the population, respectively. Representative images are from triplicate technical replicates of two or more independent biological experiments
Fig. 4
Fig. 4
ADPL profiling of differential enzyme activity correlated with distinct phenotypes in native contexts. a Representative ADPL images measuring endogenous NCEH1 activity in paired aggressive (SKOV3 and PC3) and non-aggressive (OVCAR3 and LNCaP) cancer cell lines from ovarian and prostate cancers, respectively. b Relative quantification of NCEH1 activity in each cell line from a. Statistical evaluations shown are comparing mean ADPL signal between non-aggressive and aggressive cells within each tissue of origin. Quantification in b: LNCaP (n = 47), PC3 (n = 43), OVCAR3 (n = 60), SKOV3 (n = 35). c α-Biotin western blot “gel-based” profiling of serine hydrolase activity in the four cell lines is shown. The two bands at ~42 and 45 kDa are glycoforms of NCEH1; the overlapped intermediate band is another enzyme family member. α-NCEH1 immunoblotting indicates protein abundance. α-GAPDH immunoblotting from the same experiment is shown as a loading control. Scale bars = 10 μm in all images. Blue channel: DAPI nuclear; red channel: ADPL signal; gray channel: DIC. ***P < 0.001, Student’s t test. Each dot represents a single-cell fluorescence measurement, center line and whiskers denote the mean and 95% C.I. of the population, respectively. Representative images are from quadruplicate technical replicates of three or more independent biological experiments
Fig. 5
Fig. 5
ADPL detects active enzymes and the specific action of small-molecule inhibitors. a, b Representative ADPL images (a) and quantification (b) of endogenous NCEH1 activity in SKOV3 cells with no FP-Bio probe treatment (DMSO), with FP-Bio and with FP-Bio after pre-treatment of live cells with the specific NCEH1 inhibitor JW480 (1 μM, 4 h). Quantification in b: DMSO (n = 73), FP-Bio (n = 73), FP-Bio + JW480 (n = 79). c α-biotin western blot “gel-based” profiling of NCEH1 activity from conditions in a show that while NCEH1 is present in all conditions, JW480 specifically inhibits labeling of NCEH1 by FP-Bio. d Quantification of NCEH1 activity by ADPL in wild-type or PAFAH2-expressing PC3 cells treated with JW480 prior to ADPL imaging. IC50 curves exhibit potent and precise inhibition of NCEH1 by JW480 in wild-type PC3 cells (IC50 = 6 nM) and PAFAH2-expressing PC3 cells (IC50 = 8 nM). Parallel quantification of PAFAH2 activity in the stable PC3 cell line shows no effect of JW480 over the same dose range. In b, each point represents a single-cell fluorescence measurement, center line and whiskers denote the mean and 95% C.I. of the population, respectively. Sigmoidal IC50 curves in d were generated in Prism 6 software, with center lines and error bars denoting mean and s.e.m. Scale bars = 10 μm in all images. Blue channel: DAPI nuclear; red channel: ADPL signal; gray channel: DIC. ***P < 0.001, Student’s t test. Data are from quadruplicate technical replicates in two or more biological experiments
Fig. 6
Fig. 6
ADPL quantification of endogenous enzyme activity in cellular co-culture and primary patient samples. a, b Representative ADPL images (a) and quantification (b) of NCEH1 activity in primary ovarian cancer spheroids. Simultaneous CD45 staining (green) marks immune cells present in heterogeneous spheroids. Quantification in b: immune cells (n = 25), cancer cells (n = 155). c, d Representative ADPL images (c) and quantification (d) of NCEH1 activity in cellular co-culture of aggressive SKOV3 ovarian cancer cells and primary immune cells. Quantification in d: immune cells (n = 16), cancer cells (n = 20). e, f Representative ADPL images (e) and quantification (f) of NCEH1 activity in cellular co-culture of non-aggressive OVCAR3 ovarian cancer cells and primary immune cells. Quantification in f: immune cells (n = 23), cancer cells (n = 74). g Normalized ADPL signal of OVCAR3, SKOV3, spheroid cancers cells relative to co-cultured CD45 + immune cells (data in b, d, f). Scale bar: 10 μm. Blue channel: DAPI; red channel: ADPL; green channel: CD45; gray channel: DIC. Each point represents a single-cell fluorescence measurement, center line and whiskers denote the mean and 95% C.I. of the population; unpaired Student’s t test was used for statistical significance. ***P < 0.001; ns not significant, Student’s t test. Data are from four or more technical replicates from independent duplicate biological experiments

Similar articles

Cited by

References

    1. Agapakis CM, Boyle PM, Silver PA. Natural strategies for the spatial optimization of metabolism in synthetic biology. Nat. Chem. Biol. 2012;8:527–535. doi: 10.1038/nchembio.975. - DOI - PubMed
    1. Pawson T, Nash P. Protein-protein interactions define specificity in signal transduction. Genes Dev. 2000;14:1027–1047. - PubMed
    1. Kumar A, et al. Subcellular localization of the yeast proteome. Genes Dev. 2002;16:707–719. doi: 10.1101/gad.970902. - DOI - PMC - PubMed
    1. Yu CS, Chen YC, Lu CH, Hwang JK. Prediction of protein subcellular localization. Proteins. 2006;64:643–651. doi: 10.1002/prot.21018. - DOI - PubMed
    1. Walsh C. Posttranslational Modification of Proteins: Expanding Nature’s Inventory. Englewood: Roberts and Co. Publishers; 2006.

Publication types