. 2017 Nov 24;8(1):1753.
doi: 10.1038/s41467-017-01962-x.

Single-cell absolute contact probability detection reveals chromosomes are organized by multiple low-frequency yet specific interactions

Affiliations

Single-cell absolute contact probability detection reveals chromosomes are organized by multiple low-frequency yet specific interactions

Diego I Cattoni et al. Nat Commun. .

Abstract

At the kilo- to megabase pair scales, eukaryotic genomes are partitioned into self-interacting modules or topologically associated domains (TADs) that associate to form nuclear compartments. Here, we combine high-content super-resolution microscopies with state-of-the-art DNA-labeling methods to reveal the variability in the multiscale organization of the Drosophila genome. We find that association frequencies within TADs and between TAD borders are below ~10%, independently of TAD size, epigenetic state, or cell type. Critically, despite this large heterogeneity, we are able to visualize nanometer-sized epigenetic domains at the single-cell level. In addition, absolute contact frequencies within and between TADs are to a large extent defined by genomic distance, higher-order chromosome architecture, and epigenetic identity. We propose that TADs and compartments are organized by multiple, small-frequency, yet specific interactions that are regulated by epigenetics and transcriptional state.


Conflict of interest statement

The authors declare no competing financial interests.

Figures

Fig. 1
Fig. 1
TAD organization arises from modulation of stochasticity. a Top, region of Hi-C contact matrix of chromosome 2L. The black-dotted line demarcates a TAD and pink and cyan boxes represent the Oligopaint- labeled TAD borders (TB). Chromatin epigenetic state is indicated at the bottom using the color code of panel b. Bottom, representative three-color 3D-SIM image in two orientations. DAPI, TB2, and TB3 are shown in gray, pink, and cyan, respectively. Scale bar = 1 µm for the main image. The inset displays 5× amplification of the selected region. b Oligopaint libraries in chromosomes 2L and 3R employed in this study (TB1-16 at TAD borders and IT17-19 within TADs). Colored boxes display the chromatin type of TADs as defined in Supplementary Fig. 1a, b. Red: active, blue: repressed, and black: inactive. Dotted colored lines indicate the combinations of libraries measured. c 3D distance distributions between TB2–TB2 and TB2–TB3. The mean colocalization resolution, estimated from two-color labeling of a single border (40 nm, vertical blue dashed line). Blue and black solid lines represent Gaussian fittings. The absolute contact probability between libraries was obtained from the integral of the area of the Gaussian fitting (shaded gray) below 120 nm (Supplementary Fig. 1e). N = 161 and 556 for TB2–TB2 and TB2–TB3, respectively, from more than three biological replicates. d Absolute contact probability between consecutive borders vs. genomic distance. Chromatin state of TADs is color coded as defined in panel 1b. Error bars represent SEM. e Normalized Hi-C counts between consecutive TAD borders (circles) and random loci (solid gray line) as a function of genomic distance for S2 and late embryonic cells. Matrix resolution = 10 kb. Two biological replicates for each cell type were performed. f Schematic representation of contact probability between and within TADs (solid colored lines) for late embryo and S2 cells at the chromosomal region shaded in panel b. Sizes of TADs (gray-shaded triangles) are proportional to genomic length (scale bar on top). Chromatin type is indicated at the bottom. The thickness of the lines and color indicate the absolute contact probability. Dotted lines indicate inter-TAD contacts. Early embryo measurements are depicted in Supplementary Fig. 1k. Numbers of cells for each combination are provided in Supplementary Fig. 1f–h
Fig. 2
Fig. 2
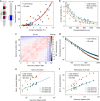
Long-range absolute contact probability is specifically modulated for each cell type. a Left, a schematic representation of pairwise distance measurements between consecutive and nonconsecutive borders, with color code and positions as in Fig. 1b. Right, normalized Hi-C counts vs. microscopy absolute contact probability for consecutive and nonconsecutive domain borders for embryo and S2 cells. Solid black and red lines represent exponential and power-law fits, respectively. Matrix resolution = 10 kb. N for microscopy pairwise measurements is provided in Supplementary Fig. 1f–h. N = 2 for Hi-C data, from at least three and two biological replicates, respectively. b Absolute contact probability vs. mean physical distance between probes for consecutive and nonconsecutive TAD borders (filled circles). Solid lines represent power-law fittings with the scaling exponent described in Supplementary Fig. 2b. Triangles represent measurements within TADs. c Matrix of relative frequency of normalized Hi-C counts for late embryo vs. S2 cells for chromosome 2L. Contact frequency ratio is color coded according to scale bar. Matrix resolution = 50 kb. N = 4, biological replicates. d Log–log plot of normalized Hi-C counts between TAD borders vs. genomic distance for embryo and S2 cells. Solid lines represent the average contact frequency for randomly chosen positions in the genome. Matrix resolution = 10 kb. N = 2, biological replicates. e,f Log–log plot of the mean physical distance vs. genomic length for (e) active and (f) inactive/repressed chromatin domains for different cell types. Mean distance values were normalized by the pre-exponential factor from the power-law fit of each data set (Supplementary Fig. 2d, e). Solid lines show the power-law fits, with the scaling exponent β shown in the panel. Circles and triangles are depicted as described in panel 2b. Error bars represent SEM. N > 140 for each data point, from more than three biological replicates (Supplementary Fig. 1)
Fig. 3
Fig. 3
Cell-type-specific frequency of long-range contacts defines chromosome folding in 3D space. a Left, schematic representation of 69 domain borders labeled by a single Oligopaint library (Lib-69) in Chr. 3R. Each probe was spanned at ~ 20 kb, and probes were separated by 320 kb on average (Supplementary Fig. 3a, b). Right, representative two-color 3D-SIM images for all studied cell types. DAPI signal (white) and Lib-69 (pink) are shown. Scale bar = 200 nm. b Left panel, single-cell probability distance distribution p(r) between all pairs of foci imaged by 3D-SIM. The white line represents the population-averaged p(r) frequency. Detailed R g and D max values are shown in Supplementary Fig. 3. D max is defined as the distance that comprises <97% of the area under the p(r) function. Right panel, number of foci per cell for each condition with mean population values shown as solid vertical lines and indicated above. N = 180, from more than three biological replicates. c Schematic representation of the chromosome structure for each cell type. The solid gray line represents the chromatin fiber and pink circles represent domain borders with sizes proportional to the number of regrouped borders. d Hi-C contact frequencies of S2 vs. late embryo cells for all the pairwise combinations of the 69 borders. The solid red line represents the relation expected if frequencies of interactions between the 69 borders were equal between cell types. Insets depict chromosome 3R and different combinations of genomic distances and frequencies of interaction between borders. Matrix resolution = 50 kb. N = 4, from at least three biological replicates
Fig. 4
Fig. 4
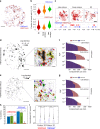
Chromatin reorganization between cell types is modulated by stochastic clustering between epigenetic domains. a Two-color dSTORM image of active (H3K4me3, blue) and repressive (H3K27me3, red) chromatin marks in a representative S2 cell. Images of early and late embryos are displayed in Supplementary Fig. 4a and panel c. Scale bar = 1 µm. b Quantification of co-occurrence (CA > 0.5) between active and repressive chromatin using aCBC. Violin plots of CAs for H3K4me3 and H3K27me3 are shown in the upper panel and lower panels, respectively. The black line represents the median of the distribution. c Representative zoomed images of two-color dSTORM for the three cell types investigated. Black arrows indicate the localization of small active chromatin domains in the periphery of large repressive domains. The lower panel displays active and repressive marks of Chip-Seq enrichment profiles for late embryo. Scale bar = 200 nm. d,e dSTORM-rendered images of Alexa-647-labeled d H3K27me3 and e H3K4me3. Images show density maps computed from the area of the polygons obtained from the Voronoï diagram with scale defined on top. Scale bar = 1 µm. Zoomed regions display detected compartments (highlighted with different colors). Scale bar = 200 nm. Additional images for all cell types and chromatin marks are displayed in Supplementary Fig. 5a, b. f,g Population-based distribution of epigenetic domain sizes as obtained from dSTORM and predicted from ChiP-seq data for H3K27me3 f and H3K4me3 g. PDF is probability density function. Single-cell distributions of physical sizes and Chip-Seq data are shown in Supplementary Figs. 5c, d and 6b, respectively. N = 60, from two to three biological replicates in microscopy imaging. h Percentage of clustering for active and inactive chromatin marks for each cell type. Error bars = SD. One-sample t test p-values: *p < 0.01; **p < 0.001. i Box plots of the distributions of normalized Hi-C counts between chromatin domains of H3K27me3 or H3K4me3 in embryos and S2 cells. The results were independent of matrix resolution (10, 20, and 50 kb). Boxes contain 50% of the data (0.67σ), and red lines mark the median values. Outliers (>3.3σ away from the mean values) are shown as black dots. p-values were calculated using the Welch t test

Similar articles

Cited by

References

    1. Sexton T, Cavalli G. The role of chromosome domains in shaping the functional genome. Cell. 2015;160:1049–1059. doi: 10.1016/j.cell.2015.02.040. - DOI - PubMed
    1. Gilbert DM, Fraser P. Three dimensional organization of the nucleus: adding DNA sequences to the big picture. Genome Biol. 2015;16:181. doi: 10.1186/s13059-015-0751-9. - DOI - PMC - PubMed
    1. de Laat W, Duboule D. Topology of mammalian developmental enhancers and their regulatory landscapes. Nature. 2013;502:499–506. doi: 10.1038/nature12753. - DOI - PubMed
    1. Dixon JR, et al. Topological domains in mammalian genomes identified by analysis of chromatin interactions. Nature. 2012;485:376–380. doi: 10.1038/nature11082. - DOI - PMC - PubMed
    1. Nora EP, et al. Spatial partitioning of the regulatory landscape of the X-inactivation centre. Nature. 2012;485:381–385. doi: 10.1038/nature11049. - DOI - PMC - PubMed

Publication types