. 2018 Jan;176(1):678-690.
doi: 10.1104/pp.17.01109. Epub 2017 Nov 22.

Coordinated Regulation of Hypocotyl Cell Elongation by Light and Ethylene through a Microtubule Destabilizing Protein

Affiliations

Coordinated Regulation of Hypocotyl Cell Elongation by Light and Ethylene through a Microtubule Destabilizing Protein

Qianqian Ma et al. Plant Physiol. 2018 Jan.

Abstract

Precise regulation of hypocotyl cell elongation is essential for plant growth and survival. Light suppresses hypocotyl elongation by degrading transcription factor phytochrome-interacting factor 3 (PIF3), whereas the phytohormone ethylene promotes hypocotyl elongation by activating PIF3. However, the underlying mechanisms regarding how these two pathways coordinate downstream effectors to mediate hypocotyl elongation are largely unclear. In this study, we identified the novel Microtubule-Destabilizing Protein 60 (MDP60), which plays a positive role in hypocotyl cell elongation in Arabidopsis (Arabidopsis thaliana); this effect is mediated through PIF3. Ethylene signaling up-regulates MDP60 expression via PIF3 binding to the MDP60 promoter. MDP60 loss-of-function mutants exhibit much shorter hypocotyls, whereas MDP60 overexpression significantly promotes hypocotyl cell elongation when grown in light compared to the control. MDP60 protein binds to microtubules in vitro and in vivo. The organization of cortical microtubules was significantly disrupted in mdp60 mutant cells and MDP60-overexpressing seedlings. These findings indicate that MDP60 is an important mediator of hypocotyl cell elongation. This study reveals a mechanism in which light and ethylene signaling coordinate MDP60 expression to modulate hypocotyl cell elongation by altering cortical microtubules in Arabidopsis.


Figures

Figure 1.
Figure 1.
MDP60 is a positive regulator of light-grown hypocotyl cell elongation. A, Diagram of MDP60 showing the target sites for CRISPR/Cas9. The coding sequence and untranslated regions of MDP60 are indicated by a black box and gray boxes, respectively. B, The mdp60 mutants were generated by CRISPR/Cas9 technology. MDP60 gene mutation was evaluated by sequencing, and the mutant sites in MDP60 are indicated by arrows. C, Real-time PCR analysis of MDP60 transcripts in wild-type (WT) and MDP60-overexpressing (OE#1 and OE#2) seedlings. UBQ11 was used as a reference gene. D, The seedlings from mdp60 mutants show much shorter hypocotyls, whereas the hypocotyls are significantly longer in MDP60-overexpressing Arabidopsis when grown in the light for 7 d. The graph shows the average hypocotyl length measured from a minimum of 40 seedlings. E, Scanning electron microscopy images of hypocotyl epidermal cells from wild-type, mdp60-2 mutant, and MDP60-overexpressing seedlings grown in the light. Bar in E = 100 μm. F, Hypocotyl cell lengths of wild-type, mdp60-2 mutant, and MDP60-overexpressing seedlings were measured and calculated from at least 500 cells. t test, *P < 0.05, **P < 0.01. Error bars represent mean ± sd.
Figure 2.
Figure 2.
Ethylene upregulates MDP60 expression to promote hypocotyl cell elongation. A, MDP60 expression was determined using quantitative real-time PCR with RNA purified from wild-type, ctr1-1, or ein2-5 5-d-old light-grown seedlings. Error bars represent ± sd (n = 3). B, Quantitative real-time PCR analysis of MDP60 RNA levels in 5-d-old wild-type and pif3 mutant seedlings treated with 10 μm ACC for the indicated times. UBQ11 was used as a reference gene. Error bars represent mean ± sd (n = 3). C, GUS staining of MDP60pro:GUS transgenic lines in the absence or presence of ACC and AVG. D, Wild-type and mdp60 mutant seedlings were grown on half-strength Murashige and Skoog medium supplemented with or without ACC in the light for 7 d. The graph shows the relative hypocotyl length measured from at least 66 seedlings per sample grown on the medium supplemented with 0 and 10 μm ACC under light growth conditions. Three independent experiments were performed with similar results, each with three biological repeats. t test, **P < 0.01, error bars represent the mean ± se, n = 3. E, MDP60 transgenic mutant ein2-5 (OE#1/ein2 and OE#2/ein2) seedlings had much longer hypocotyls than wild-type seedlings but were similar in hypocotyl length to MDP60 transgenic wild-type (OE#1) seedlings when grown in the light for 7 d. The graph shows the average hypocotyl length measured from at least 41 seedlings per sample (**P < 0.01, t test). Error bars indicate the mean ± sd. F, Lengths of hypocotyl cells from wild-type, ein2-5, and MDP60 transgenic ein2-5 mutants (OE#1/ein2) and wild-type seedlings (OE#1) grown in the light for 7 d. t test, *P < 0.05, **P < 0.01. Error bars represent mean ± sd.
Figure 3.
Figure 3.
Light downregulates MDP60 through PIF3 during hypocotyl cell elongation. A, GUS staining of MDP60pro:GUS and MDP60mpro:GUS transgenic seedlings. B, MDP60 expression as determined using quantitative real-time PCR with RNA purified from wild-type, phyB-9, PIF3-overexpressing (PIF3ox), or pif3 mutant light-grown seedlings. Error bars represent ± sd (n = 3). C, ChIP-qRT-PCR assay of PIF3 binding to MDP60 promoters in vivo. Chromatin from light-grown PIF3pro:PIF3-YFP transgenic seedlings was immunoprecipitated with an anti-GFP antibody, and the amount of indicated DNA in the immune complex was determined by qRT-PCR. DNA precipitated without addition of the antibody (-Ab) as a negative control. At least three independent experiments were performed with similar results. Data are the mean values of three replicates ± sd from one experiment. D, EMSA assay for PIF3 binding to MDP60 promoters. Each biotin-labeled DNA fragment was incubated with the GST-PIF3 protein. Competition for labeled promoter sequences was performed by adding an excess of unlabeled wild-type or mutated probes. The arrow indicates bands caused by PIF3 binding to the P fragment in the MDP60 promoter. E, Y1H analysis using P fragments containing a wild-type G-box (MDP60pro) and mutated G-box (MDP60mpro) as bait and PIF3 as prey. Representative growth status of yeast cells is shown on SD/-UHL agar media with 3-amino-1,2,4-triazole from triplicate independent trials. Numbers on the right side of each photograph indicate relative densities of the cells. F, Transient expression of PIF3 and MDP60pro:GUS or MDP60mpro:GUS in N. benthamiana leaves. Each data bar represents the mean ± sd (n = 3). G, The MDP60 transgenic pif3 mutant (OE#1/pif3 and OE#2/pif3) had much longer hypocotyls than wild-type seedlings but had similar hypocotyl length to MDP60 transgenic wild-type (OE#1) seedlings grown in the light for 7 d. The graph shows the average hypocotyl length measured from at least 43 seedlings per sample. (**P < 0.01, t test). Error bars indicate mean ± sd. H, Lengths of hypocotyl cells from wild-type, pif3, MDP60 transgenic pif3 mutant (OE#1/pif3), and wild-type (OE#1) seedlings grown in the light for 7 d. t test, *P < 0.05, **P < 0.01. Error bars represent the mean ± sd.
Figure 4.
Figure 4.
MDP60 directly binds to microtubules. A, MDP60-His was cosedimented with paclitaxel-stabilized microtubules. MDP60-His was most abundant in the supernatant (S) in the absence of microtubules, but cosedimented with microtubules into pellets (P). B, GFP-MDP60 was transiently expressed in Arabidopsis pavement cells where it formed filamentous structures. The filamentous pattern of GFP-MDP60 was disrupted when cells were treated with 10 μm oryzalin for 30 min (C) but was unaffected when treated with 100 nm LatA for 30 min (D). E to G, Colocalization of transiently expressed GFP-MDP60 and MBD-mCherry. Plot of a line scan drawn in G showing a strong correlation between spatial localization of GFP-MDP60 and MBD-mCherry. H to J, The localization could be disrupted via oryzalin. Bars in D, G, and J = 20 μm.
Figure 5.
Figure 5.
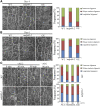
The cortical microtubule array is greatly altered in hypocotyl epidermal cells of MDP60 transgenic seedlings. A and B, Cortical microtubules in epidermal cells from the middle regions of hypocotyls from wild-type (WT), mdp60-2 mutant, and MDP60 transgenic (OE) seedlings in a YFP-tubulin background were observed by confocal microscopy after growth in the light for 4 or 6 d. The graphs show the frequencies of different microtubule orientation patterns in light-grown hypocotyl epidermal cells from wild-type, mdp60-2, and OE seedlings (n > 65 cells). Bars in A and B = 10 μm. C, Wild-type and mdp60-2 hypocotyls in a YFP-tubulin background were transferred to medium containing 0 or 10 μm ACC for 0, 40, and 80 min. Cortical microtubules from the middle regions of hypocotyl epidermal cells were observed. The graphs show the frequencies of microtubule orientation patterns in the middle regions of wild-type and mdp60-2 hypocotyl epidermal cells (n > 65 cells). Bar in C = 10 μm.
Figure 6.
Figure 6.
MDP60 is a microtubule destabilizer. A, Fluorescent images of microtubules polymerized in 20 μm rhodamine-labeled tubulin solution in the presence of 0, 1, and 4 μm MDP60. Bar in A = 10 μm. B, Negative stain electron micrographs of A. Bar in B = 5 μm Cortical microtubules were observed in epidermal cells in the middle regions of hypocotyls from light-grown wild-type (WT), mdp60-2, and MDP60-overexpressing (OE) seedlings after treatment with 0 μm oryzalin (C), 10 μm oryzalin for 10 min (D), and 10 μm oryzalin for 30 min (E). Bar in E = 10 μm. F, Quantification of cortical microtubules in hypocotyl epidermal cells of wild-type, mdp60-2, and OE seedlings using ImageJ software (n > 30 cells for each sample). The y axis represents the number of cortical microtubules that crossed a fixed line (∼10 μm) perpendicular to the orientation of the majority of cortical microtubules in the cell. *P < 0.05, **P < 0.01, t test. Error bars represent mean ± sd.
Figure 7.
Figure 7.
Working model of upstream signaling-mediated hypocotyl cell elongation through diverse MAP regulation of cortical microtubules. Arrows show positive regulation, and bar ends show inhibitory action. WDL3 suppresses hypocotyl cell elongation in the light, whereas WDL5 and MDP40 mediate hypocotyl cell elongation in the dark. Ca2+ regulates activity of MDP25 to inhibit hypocotyl cell elongation. In this study, we showed that light and ethylene coordinate MDP60 expression through PIF3, and MDP60 alters cortical microtubule organization via microtubule-destabilizing activity, which promotes hypocotyl cell elongation.

Similar articles

Cited by

References

    1. Alonso JM, Hirayama T, Roman G, Nourizadeh S, Ecker JR (1999) EIN2, a bifunctional transducer of ethylene and stress responses in Arabidopsis. Science 284: 2148–2152 - PubMed
    1. Al-Sady B, Ni W, Kircher S, Schäfer E, Quail PH (2006) Photoactivated phytochrome induces rapid PIF3 phosphorylation prior to proteasome-mediated degradation. Mol Cell 23: 439–446 - PubMed
    1. Bours R, Kohlen W, Bouwmeester HJ, van der Krol A (2015) Thermoperiodic control of hypocotyl elongation depends on auxin-induced ethylene signaling that controls downstream PHYTOCHROME INTERACTING FACTOR3 activity. Plant Physiol 167: 517–530 - PMC - PubMed
    1. Boutrot F, Segonzac C, Chang KN, Qiao H, Ecker JR, Zipfel C, Rathjen JP (2010) Direct transcriptional control of the Arabidopsis immune receptor FLS2 by the ethylene-dependent transcription factors EIN3 and EIL1. Proc Natl Acad Sci USA 107: 14502–14507 - PMC - PubMed
    1. Castillon A, Shen H, Huq E (2007) Phytochrome Interacting Factors: central players in phytochrome-mediated light signaling networks. Trends Plant Sci 12: 514–521 - PubMed

Publication types

MeSH terms