The Cellular Composition and Glia-Neuron Ratio in the Spinal Cord of a Human and a Nonhuman Primate: Comparison With Other Species and Brain Regions
- PMID: 29150977
- PMCID: PMC5845477
- DOI: 10.1002/ar.23728
The Cellular Composition and Glia-Neuron Ratio in the Spinal Cord of a Human and a Nonhuman Primate: Comparison With Other Species and Brain Regions
Abstract
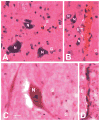
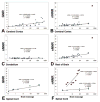
The cellular composition of brains shows largely conserved, gradual evolutionary trends between species. In the primate spinal cord, however, the glia-neuron ratio was reported to be greatly increased over that in the rodent spinal cord. Here, we re-examined the cellular composition of the spinal cord of one human and one nonhuman primate species by employing two different counting methods, the isotropic fractionator and stereology. We also determined whether segmental differences in cellular composition, possibly reflecting increased fine motor control of the upper extremities, may explain a sharply increased glia-neuron ratio in primates. In the cynomolgus monkey spinal cord, the isotropic fractionator and stereology yielded 206-275 million cells, of which 13.3-25.1% were neurons (28-69 million). Stereological estimates yielded 21.1% endothelial cells and 65.5% glial cells (glia-neuron ratio of 4.9-5.6). In human spinal cords, the isotropic fractionator and stereology generated estimates of 1.5-1.7 billion cells and 197-222 million neurons (13.4% neurons, 12.2% endothelial cells, 74.8% glial cells), and a glia-neuron ratio of 5.6-7.1, with estimates of neuron numbers in the human spinal cord based on morphological criteria. The non-neuronal to neuron ratios in human and cynomolgus monkey spinal cords were 6.5 and 3.2, respectively, suggesting that previous reports overestimated this ratio. We did not find significant segmental differences in the cellular composition between cervical, thoracic and lumbar levels. When compared with brain regions, the spinal cord showed gradual increases of the glia-neuron ratio with increasing brain mass, similar to the cerebral cortex and the brainstem. Anat Rec, 301:697-710, 2018. © 2017 Wiley Periodicals, Inc.
Keywords: evolution; glia neuron ratio; human; isotropic fractionator; primate; quantification; spinal cord; stereology.
© 2017 Wiley Periodicals, Inc.
Figures


Similar articles
-
Glia to neuron ratio in the posterior aspect of the human spinal cord at thoracic segments relevant to spinal cord stimulation.J Anat. 2019 Nov;235(5):997-1006. doi: 10.1111/joa.13061. Epub 2019 Jul 26. J Anat. 2019. PMID: 31347695 Free PMC article.
-
Validation of the isotropic fractionator: comparison with unbiased stereology and DNA extraction for quantification of glial cells.J Neurosci Methods. 2014 Jan 30;222:165-74. doi: 10.1016/j.jneumeth.2013.11.002. Epub 2013 Nov 12. J Neurosci Methods. 2014. PMID: 24239779 Free PMC article.
-
The search for true numbers of neurons and glial cells in the human brain: A review of 150 years of cell counting.J Comp Neurol. 2016 Dec 15;524(18):3865-3895. doi: 10.1002/cne.24040. Epub 2016 Jun 16. J Comp Neurol. 2016. PMID: 27187682 Free PMC article. Review.
-
The use of the optical disector to estimate the number of neurons, glial and endothelial cells in the spinal cord of the mouse--with a comparative note on the rat spinal cord.Brain Res. 1993 Nov 5;627(1):25-33. doi: 10.1016/0006-8993(93)90744-8. Brain Res. 1993. PMID: 8293301
-
Not all brains are made the same: new views on brain scaling in evolution.Brain Behav Evol. 2011;78(1):22-36. doi: 10.1159/000327318. Epub 2011 Jun 17. Brain Behav Evol. 2011. PMID: 21691045 Review.
Cited by
-
The Absolute Number of Oligodendrocytes in the Adult Mouse Brain.Front Neuroanat. 2018 Oct 30;12:90. doi: 10.3389/fnana.2018.00090. eCollection 2018. Front Neuroanat. 2018. PMID: 30425626 Free PMC article.
-
The Concept of Neuroglia.Adv Exp Med Biol. 2019;1175:1-13. doi: 10.1007/978-981-13-9913-8_1. Adv Exp Med Biol. 2019. PMID: 31583582 Free PMC article. Review.
-
Lactate-Protected Hypoglycemia (LPH).Front Neurosci. 2020 Sep 3;14:920. doi: 10.3389/fnins.2020.00920. eCollection 2020. Front Neurosci. 2020. PMID: 33013305 Free PMC article.
-
Glia to neuron ratio in the posterior aspect of the human spinal cord at thoracic segments relevant to spinal cord stimulation.J Anat. 2019 Nov;235(5):997-1006. doi: 10.1111/joa.13061. Epub 2019 Jul 26. J Anat. 2019. PMID: 31347695 Free PMC article.
-
Cell numbers, distribution, shape, and regional variation throughout the murine hippocampal formation from the adult brain Allen Reference Atlas.Brain Struct Funct. 2019 Nov;224(8):2883-2897. doi: 10.1007/s00429-019-01940-7. Epub 2019 Aug 23. Brain Struct Funct. 2019. PMID: 31444616 Free PMC article.
References
-
- Andersen BB, Korbo L, Pakkenberg B. A quantitative study of the human cerebellum with unbiased stereological techniques. J Comp Neurol. 1992;326:549–560. - PubMed
-
- Andersen BB, Pakkenberg B. Stereological quantitation in cerebella from people with schizophrenia. Br J Psychiatry. 2003;182:354–361. - PubMed
-
- Andersen K, Andersen BB, Pakkenberg B. Stereological quantification of the cerebellum in patients with Alzheimer’s disease. Neurobiol Aging. 2012;33:197, e11–20. - PubMed
-
- Azevedo FA, Carvalho LR, Grinberg LT, Farfel JM, Ferretti RE, Leite RE, Jacob Filho W, Lent R, Herculano-Houzel S. Equal numbers of neuronal and nonneuronal cells make the human brain an isometrically scaled-up primate brain. J Comp Neurol. 2009;513:532–541. - PubMed
-
- Araque A, Carmignoto G, Haydon PG. Dynamic signaling between astrocytes and neurons. Annu Rev Physiol. 2001;63:795–813. - PubMed
Publication types
MeSH terms
Grants and funding
LinkOut - more resources
Full Text Sources
Other Literature Sources

