. 2017 Nov 16;551(7680):340-345.
doi: 10.1038/nature24302. Epub 2017 Nov 8.

Inflammation-induced IgA+ cells dismantle anti-liver cancer immunity

Affiliations

Inflammation-induced IgA+ cells dismantle anti-liver cancer immunity

Shabnam Shalapour et al. Nature. .

Erratum in

  • Erratum: Inflammation-induced IgA+ cells dismantle anti-liver cancer immunity.
    Shalapour S, Lin XJ, Bastian IN, Brain J, Burt AD, Aksenov AA, Vrbanac AF, Li W, Perkins A, Matsutani T, Zhong Z, Dhar D, Navas-Molina JA, Xu J, Loomba R, Downes M, Yu RT, Evans RM, Dorrestein PC, Knight R, Benner C, Anstee QM, Karin M. Shalapour S, et al. Nature. 2017 Dec 21;552(7685):430. doi: 10.1038/nature25028. Epub 2017 Nov 22. Nature. 2017. PMID: 29168501 Free PMC article.
  • Author Correction: Inflammation-induced IgA+ cells dismantle anti-liver cancer immunity.
    Shalapour S, Lin XJ, Bastian IN, Brain J, Burt AD, Aksenov AA, Vrbanac AF, Li W, Perkins A, Matsutani T, Zhong Z, Dhar D, Navas-Molina JA, Xu J, Loomba R, Downes M, Yu RT, Evans RM, Dorrestein PC, Knight R, Benner C, Anstee QM, Karin M. Shalapour S, et al. Nature. 2018 Sep;561(7721):E1. doi: 10.1038/s41586-018-0304-y. Nature. 2018. PMID: 29973714 Free PMC article.

Abstract

The role of adaptive immunity in early cancer development is controversial. Here we show that chronic inflammation and fibrosis in humans and mice with non-alcoholic fatty liver disease is accompanied by accumulation of liver-resident immunoglobulin-A-producing (IgA+) cells. These cells also express programmed death ligand 1 (PD-L1) and interleukin-10, and directly suppress liver cytotoxic CD8+ T lymphocytes, which prevent emergence of hepatocellular carcinoma and express a limited repertoire of T-cell receptors against tumour-associated antigens. Whereas CD8+ T-cell ablation accelerates hepatocellular carcinoma, genetic or pharmacological interference with IgA+ cell generation attenuates liver carcinogenesis and induces cytotoxic T-lymphocyte-mediated regression of established hepatocellular carcinoma. These findings establish the importance of inflammation-induced suppression of cytotoxic CD8+ T-lymphocyte activation as a tumour-promoting mechanism.


Conflict of interest statement

The authors declare no competing financial interests.

Figures
Extended Data Figure 1
Extended Data Figure 1. NASH-induced accumulation of IgA+ plasmocytes in human liver
a, Serum IgA levels of patients with NAFLD/NASH (Newcastle cohort; n = 502) were analysed and compared with clinical data. b, Serum was collected from a second cohort of patients with NAFLD/NASH (San Diego cohort; n = 96), whose degree of liver fibrosis was measured by MRI and classified as grades 0 (n = 51), 1–2 (n = 33), and 3–4 (n = 12). Serum concentrations of IgA, IgG, and IgM were determined by ELISA and plotted against the fibrosis grade. c, Single-cell suspensions were prepared from liver biopsies taken from patients with NASH (n = 4) with fibrosis, stained with antibodies to IgA, CD19, and PD-L1, and analysed by flow cytometry. Blood collected from three healthy donors (used as a surrogate for liver biopsies that could not be obtained from such individuals; HD), stained with antibodies, as indicated. Shown are representative scatter plots from two patients and two healthy donors, and bar graphs compiling data from all samples and depicting PD-L1 expression by IgA+ cells. d, Single-cell suspensions were prepared from liver biopsies as above (n = 3 per group) and stained with antibodies to CD4, CD8, Tim-3, and PD-1. Shown are representative data from one patient and one healthy donor with bar graphs compiling results obtained from three patients and depicting frequencies of PD-1+CD8+ T cells. χ2 test (a) and two-sided t-test (means ± s.e.m.; ad) were used to determine significance. * P < 0.05; * * P < 0.01; * * * P < 0.001; NS, not significant.
Extended Data Figure 2
Extended Data Figure 2. Experimental scheme and comparison of different NASH, HCC, and liver damage mouse models
a, In the HFD-fed MUP-uPA model, MUP-uPA, MUP-uPA/Iga−/−, MUP-uPA/μMT−/−, MUP-uPA/Rag1−/−, and MUP-uPA/Cd8a−/− male mice were kept on normal chow (NC) or placed on high-fat diet (HFD) starting at 8 weeks of age. Mice were analysed for NASH-related immune parameters and pathology at 6 months of age and for HCC-related parameters at 11 months of age (n = 543 mice analysed in 50 experiments). Mice were treated with a cocktail of broad spectrum antibiotics (Abx) from 3 to 6 months or from 6 to 11 months to determine microbe impact on NASH and HCC, respectively. Mice were also subjected to weekly anti-PD-L1 or anti-CD8 antibody injections starting at 9 months of age for a total of 8 or 6 weeks before being evaluated for HCC. In the STAM model, male mice of the indicated genotype were subcutaneously injected with 200 μg streptozotocin (STZ) 2 days after birth and fed with HFD after 4 weeks of age. Tumour multiplicity, immune parameters, and pathology were determined when the mice were 25 or 20 weeks of age in either the BL6 or FVB backgrounds, respectively (n = 123 mice analysed in 15 experiments). STAM-Iga−/− mice were also subjected to weekly anti-CD8 antibody injections for a total of 5 weeks before being evaluated for HCC. In the MCD-HFD-fed model, mice were kept on a methionine and choline deficient (MCD) diet with 60 kcal% fat, for 4 weeks (n = 65 analysed in three experiments). In the CCl4 model, mice were injected intraperitoneally with CCl4 twice a week for 8 weeks (n = 82 analysed in six experiments). b, Paraffin-embedded and frozen mouse liver sections (n = 3–9 per group as indicated) were stained with haematoxylin and eosin (H&E) to determine liver histology (scale bar, 100 μm), Sirius Red (SR) to determine collagen fibre deposition (scale bar, 100 μm), or Oil Red O (ORO) to determine lipid droplet accumulation (scale bar, 50 μm). c, Paraffin-embedded human liver sections from patients with NASH and ASH were stained with Sirius Red to determine collagen fibre deposition (n = 5 per group with one representative shown; scale bar, 250 μm). The data were validated in at least two or three experiments. d, Spleen content of IgA+ cells (absolute cell number per spleen) in different mouse strains and treatment groups (n = 11, 6, 8, 13, 11, 9). e, f, Indicated mice were placed on the different models described in a. At the endpoints, mouse body weights were measured (e) (n = 6, 5, 8, 10, 3, 10, 11, 31, 15, 6, 9) and sera were analysed for ALT (f) (n = 6, 5, 6, 5, 3, 13, 3, 10, 8, 3, 6), an indicator of liver damage. g, h, Collagen deposition and lipid droplets were quantified using image analysis software, and data points for individual mice are shown (g: n = 11, 6, 3, 9, 3, 8, 4, 6, 5; h: n = 6, 5, 3, 3, 3, 5, 4, 8, 4, 3, 6). i, Total RNA was extracted from livers of indicated mice and analysed by RT-PCR using primers for Tgfb1 (n = 6, 5, 3, 7, 7, 6, 6). j, Hepatic stellate cells (HSC), CD11b+ Kupffer cells (KC), and CD11b non-parenchymal cells (NPC) from the indicated mice were isolated from livers. Total RNA was extracted from these cells and analysed for Tgfb1 mRNA expression (n = 3–5). k, l, CD4+ T cells were sorted from livers of normal chow- and HFD-fed WT or HFD-fed MUP-uPA mice using CD4, CD8, CD45, and CD3 antibodies. RNA was extracted and analysed by RT-PCR using primers for Il21, Bcl6, and Icos (n = 4–7 as indicated). m, Total RNA was extracted from livers of indicated mice and analysed by RT-PCR for Il33 (n = 4, 5, 3, 7, 8, 6, 6). n, o, Total RNA was extracted from livers of indicated mice at 6 months (n = 29 mice in total, with 3–8 mice per group as indicated) (n) or tumours of indicated mice at 11 months of age (n = 7, 9) (o), and analysed by RT-PCR for chemokine and cytokine mRNA. The heat map in n depicts the differential expression of immune-regulatory genes. Two-sided t-test (means ± s.e.m.; gm) and Mann–Whitney test (median; df, o) were used to determine significance. * P < 0.05; * * P < 0.01; * * * P < 0.001. N values for each group are shown either in individual panels or in legends for each group from left to right accordingly.
Extended Data Figure 3
Extended Data Figure 3. IgA characterization in the indicated tissue of STAM and MUP-uPA mice
ae, Single splenocyte or liver cell suspensions from tumour (HCC)-bearing mice (STAM-B6) were stained with CD45, CD19, IgA, CD138, B220, and PD-L1, and FVD-eF780 was used to exclude dead cells. a, The gating strategies for splenocytes and liver lymphocytes: lymphocyte gate, dead cell exclusion, doublets exclusion, and CD45+ population gate. b, Flow cytometry analysis of IgA and CD19 expression of indicated strains, gated on the CD45+ population. Spleen or liver from Iga−/− mice was used to set up the gating for the populations. Tgfbr2ΔB and Pdl1/2−/− mice clearly showed less IgA+ cells than WT mice. ce, IgA subpopulations were gated as indicated and analysed for CD138, B220, and PD-L1 expression. IgA subpopulations were gated on the basis of CD19 expression, in the indicated strains, and the IgA+CD19+, IgA+CD19−/low/int, and IgACD19+ subpopulations were further analysed for their B220 and CD138 expression. The decisions for CD19 and CD138 levels were also based on their mean fluorescence intensity (MFI; red). The analyses showed two main populations: (1) IgA+CD19+B220+CD138low/− and (2) IgA+CD19−/intB220CD138+/hi. These two populations and the IgACD19+ populations were further analysed for their ability to express PD-L1 (percentage and mean fluorescence intensity). fj, Single-cell suspensions were prepared from the spleen, liver, or intestine of MUP-uPA mice kept on normal chow or HFD, and were stained with CD45, CD19, IgA, B220, CD138, CD11b, MHCII, PD-L1, and CD5, and analysed by flow cytometry. f, The B220 and CD138 expression in total IgA+ cells (CD19+ and CD19 populations) confirmed that most of the IgA+ cells in spleen and liver of HFD-fed MUP-uPA mice are CD138+ cells. g, h, IgA subpopulations in liver (g) and spleen (h) were gated as indicated and analysed for CD138, B220, and MHCII expression. i, Representative dot-plots gated on IgA+ cells, showing that most of the IgA+ cells are not CD11b+. j, PD-L1 and CD5 expression of IgA+ cells in spleen, liver, and intestine.
Extended Data Figure 4
Extended Data Figure 4. IgA+ cells in NASH livers express PD-L1
a, Single-cell suspensions were prepared from the livers of tumour-bearing mice (STAM-B6) as indicated. Shown are the PD-L1 and IgA staining in the indicated strains. Spleen or liver from Iga−/− and Pdl1/2−/− mice were used as control for IgA and PD-L1 staining. b, Liver single-cell suspensions of MUP-uPA mice and indicated strains were stained for CD45, IgA, and PD-L1. Percentages of liver PD-L1+ cells in CD45+IgA (labelled: CD45+) or IgA+ cell populations from the indicated strains are shown (n = 8, 6, 6, 7, 6, 6, 18, 16, 11, 12). c, Percentages of liver PD-L1+CD45+ cells are shown in the indicated strains (n = 5, 6, 6, 16, 10). The data were validated in at least three different experiments. d, e, CD138+ cells were divided into IgA+ and IgA populations and analysed for PD-L1 expression. d, Shown is the mean fluorescence intensity of PD-L1 expression for CD138+ cells from spleen (gated on either CD138+IgA or CD138+IgA+ cells). e, Mean fluorescence intensity of PD-L1 expression is shown for CD138+ plasmocytes from livers of 19 mice (gated on either CD138+IgA or CD138+IgA+ plasma cells). f, Percentages of intestinal IgA+ cells in MUP-uPA mice kept on normal chow or HFD (n = 6, 13; left). Percentages of PD-L1+IgA+ cells in intestine and liver are included for comparison (n = 7, 8; right). g, Percentages of liver IgA+ cells are shown in the indicated strains kept on HFD at the age of 3 months (n = 9, 7). h, Percentages of PD-L1+ cells are shown gated on CD45+CD19IgA cells in the indicated strains (n = 3, 4, 5). The data were validated at least in two or three experiments. Two-sided Mann– Whitney tests (median; b, c, e–h) were used to determine significance. * P < 0.05; * * P < 0.01; * * * P < 0.001. N values for each group in each panel are provided from left to right accordingly.
Extended Data Figure 5
Extended Data Figure 5. CD8+ T cells and IgA+ plasmocytes are only marginal players in the MUP-uPA NASH model
a, Comparison of weight gain by different strains of mice kept either on normal chow or HFD. Mice were continuously monitored from 8 to 46 weeks, and 20 data points were used to analyse weight gain, with at least 11–52 mice per time point (see Supplementary Source Data), and 5 BL6 mice on normal chow were used as controls. be, Sera, blood, and liver samples were collected from mice of the indicated strains and ages. Serum and blood samples were analysed for ALT (n = 13, 13, 16) (b), glucose tolerance test (n = 3–6 as indicated) (c), cholesterol (n = 5, 8, 9, 7) (d), or triglycerides (n = 5, 8, 9, 7) (e, left). Liver extracts were analysed for triglycerides (e, right) (n = 5, 9, 11, 7). f, Total RNA was extracted from livers of indicated mice and analysed by RT-PCR for Col1a1 mRNA (n = 4, 4, 3, 6, 4, 8). gi, Paraffin-embedded and frozen liver sections were stained with haematoxylin and eosin to determine liver histology (scale bar, 100 μm except 50 μm in the second panel of g), Sirius Red to determine collagen fibre deposition (scale bar, 100 μm), or Oil Red O to determine lipid droplet accumulation (scale bar, 50 μm) in the indicated strains and models (Extended Data Fig. 2a). Representative images are shown and were validated at least two or three times. Collagen deposition and lipid droplets were quantified using image analysis software and data points for individual mice are shown on the right for the MUP-uPA (g) (Sirius Red: n = 9, 14, 10; Oil Red O: 5, 6, 3) and MCD (h) (n = 3 per group) models. i, Representative Sirius Red staining for the CCl4 model (n = 4 or 5 mice per group). j, Total RNA from livers of 6-month-old mice of the indicated genotypes was subjected to RNA-seq analysis. Shown is the hierarchical clustering of gene expression profiles comparing HFD- and normal-chow-fed mouse liver samples. The top three enriched pathways/functional categories from Metascape were reported for major clusters of genes. k, Total RNA from livers of indicated mice was analysed by RT-PCR for alpha-fetoprotein (Afp) mRNA (n = 5, 5, 6, 5, 6, 6, 5, 8, 6, 6). The data were validated at least in two or three experiments (see Supplementary Tables 1 and 2). Two-way ANOVA (means ± s.e.m.; a, c), two-sided t-test (means ± s.e.m.; fh, k), and Mann–Whitney test (median; b, d, e, g, h) were used to determine significance. * P < 0.05; * * P < 0.01; * * * P < 0.001. N values for each group are shown either in individual panels or in legends for each group from left to right accordingly.
Extended Data Figure 6
Extended Data Figure 6. IgA ablation inhibits, while CD8 deficiency accelerates HCC development
a, b, Total DNA was extracted from HCC nodules of 11-month-old mice (n = 16) of the indicated genotypes with or without anti-PD-L1 treatment, and subjected to exome sequencing. Shown are the number of point mutations identified per sample (a) and mutational signatures (b). Horizontal axis shows the 96-substitution patterns with substitution subtypes on top, and vertical axis indicates the probability of each pattern in b. c, Top 20 hallmark gene sets sorted by normalized enrichment score (NES) are shown to depict HCC progression in MUP-uPA and MUP-uPA/Iga−/− mice by gene set enrichment analysis. Immune-related gene sets are coloured blue. The gene sets previously described, for human HCC are marked with a red asterisk. d, Total RNA was extracted from livers of 6-month-old mice and from HCC nodules of 11-month-old mice of the indicated genotypes and subjected to RNA-seq analysis. Hierarchical clustering of gene expression profiles comparing HCC and non-HCC mouse samples according to the RNA-seq. The top three enriched pathways/functional categories from Metascape are reported for major clusters of genes. e, Representative images of liver histology at different time points and indicated strains are shown with detailed n values. Scale bars, 100 μm (3 months), 250 μm (6, 11 months). f, Total tumour numbers in 3-month-old MUP-uPA mice (n = 11, 7, 8). g, Heat map depicting differential expression of 17 liver-specific genes and 33 HCC-related genes in the indicated strains, illustrating the upregulation of some HCC-related genes in MUP-uPA/Cd8a−/− livers at 6 months of age (total mice number 29; n = 3 or 4 per group). hj, BL6 mice of the indicated phenotype were subjected to the STAM protocol and their tumour volumes (n = 14, 6, 6, 4, 3, 9, 3) (h) and histopathology (i, j) were evaluated at 25 weeks of age. The data were validated at least in two or three experiments. Paraffin-embedded and frozen liver sections from these mice were stained with haematoxylin and eosin, Sirius Red, or Oil Red O, as indicated. Shown are typical images of tumour-containing and tumour-free areas, the borders between which are marked by the black lines. Scale bars: haematoxylin and eosin, 100 μm; Sirius Red, 100, 250, or 500 μm; Oil Red O, 50 μm. Oil Red O-positive areas were quantitated and are shown on the right. The Sirius Red-stained areas for each mouse were calculated by image analysis of the whole-tissue scan and normalized to the haematoxylin and eosin stain (n = 3 or 4 per group). k, Tumour volumes are shown for STAM-WT (n = 10), STAM-Iga−/− (n = 13), and STAM-Iga−/− after CD8 depletion (n = 3). l, MUP-uPA/Iga−/−-HFD mice were injected weekly with anti-CD8 for 6 weeks and tumour multiplicity was determined (n = 3). k, l, CD8 depletion experiments were repeated using two different HCC models (MUP and STAM). m, Heat map depicting the differential expression of 59 genes involved in allograft rejection, IFNγ response, and inflammation (total mouse number 41; 6 months: n = 3 and 11 months: 3 or 4 per group). n, o, Paraffin-embedded and frozen liver sections from 11-month-old mice (n) and adoptively transferred mice (o) were stained with haematoxylin and eosin, Sirius Red, or Oil Red O as indicated and analysed (Sirius Red: n = 9, 16, 14, 6; Oil Red O: n = 8, 5, 5, 8 for n). Shown are typical images of tumourcontaining and tumour-free areas, the borders between which are marked by the black lines. p, Liver cells from MUP-uPA/Rag1−/− mice 1 week after being adoptively transferred with CFSE-labelled T cells with or without B cells as indicated (n = 3 in each group) were stained and analysed by flow cytometry. Shown are the percentage of CD8+ T cells among CD45+ cells (left), and histogram of proliferating CFSE-labelled T cells with the corresponding mean fluorescence intensity (right). q, Liver sections for MUP-uPA/Rag1−/− and the corresponding adoptive lymphocyte transfer mice (4 weeks after adoptive transfer (AT)) were stained with alpha-SMA, IgA, CD3, and CD8 antibodies, counterstained with DAPI and examined by fluorescent microscopy (scale bars, 50 μm). For CD3/CD8 staining, images with higher magnification are shown (scale bars, 20 μm). Single-cell suspensions were prepared from the corresponding liver, stained with antibodies to CD45, IgA, CD19, B220, CD8, and CD4, and analysed by flow cytometry. Shown are representative scatter plots. MUP;Rag1−/− mouse livers have been used for validation of CD4, CD8, IgA, and CD19, both for flow cytometry and for immunofluorescence analyses. The data were validated in at least two experiments. r, STAM-BL6 mice of the indicated phenotypes were analysed for IgA serum amounts by ELISA (n = 11, 4, 4, 4, 4). s, Absolute IgA+ cell number in livers of indicated STAM-BL6 mice (n = 13, 4, 4, 9, 8). Each dot represents a mouse. Two-sided t-test (means ± s.e.m.; f, j, l, n, r) and Mann–Whitney test (median; h, k, n, s) were used to determine significance. * P < 0.05; * * P < 0.01; * * * P < 0.001. N values for each group are shown either in individual panels or in legends for each group from left to right accordingly.
Extended Data Figure 7
Extended Data Figure 7. Gut microbes promote HCC development and microbial translocation does not account for the anti-tumorigenic effect of IgA ablation
aj, MUP-uPA and MUP-uPA/Iga−/− mice were placed on HFD and treated with broad spectrum antibiotics (Abx) as described in Extended Data Fig. 2a, from 3 to 6 months (all panels except right part of b, and d, h, i) or 6 to 11 months (right part of b, and d, h, i) of age. At the end of the treatments, the stool contents of the corresponding mice were subjected to eubacterial 16S rRNA encoding DNA sequencing. a, Principal coordinate analysis plot of microbiome data using unweighted UniFrac distances; antibiotic treatment was significant by PERMANOVA (pseudo-F statistic = 105.5, P = 0.001) (left: n = 181, 27 as indicated; right: n = 6, 3, 6, 3). Mouse weight (6 months: n = 5, 6, 13, 7; 11 months: n = 8, 6, 5, 7) (b) and circulating ALT (n = 12, 5, 12, 6) (e) were measured. c, d, Paraffin-embedded and frozen liver sections from the above mice were stained with haematoxylin and eosin, Sirius Red, or Oil Red O, and were analysed for collagen deposition and lipid droplets as indicated. Scale bars, 50 μm for Oil Red O; 100 μm for haematoxylin and eosin, and Sirius Red (Sirius Red: n = 9, 6, 14, 7 for c and 4, 4, 5 for d; Oil Red O: n = 5, 3, 6, 3 mice). The data were validated at least in two or three experiments. fh, j, Liver cell suspensions were stained with antibodies as indicated, and analysed by flow cytometry. Each dot represents one mouse. Shown are percentages of CD8+ cells in total cells (n = 11, 5, 9, 7), CD8+CD44+ (n = 10, 4, 11, 6) or CD8+IFNγ +CD107a+TNF+ (n = 8, 6, 9, 7) cells in CD8+ T cells (f), CD19+B220+ cells in CD45+ cells (n = 9, 6, 11, 7) (g), IgA+ cells in CD45+ cells (n = 6, 6, 6, 3, 6, 6) (h), and CD4+ cells in CD45+ cells (n = 9, 6, 11, 7) or IL-17+ cells in CD4+ T cells (n = 9, 6, 10, 6) (j). i, MUP-uPA mice placed on HFD and treated with antibiotics were analysed for serum IgA by ELISA (n = 4, 8, 5, 6, 5, 5). Note that flow cytometry data of MUP-uPA and MUP-uPA/Iga−/− mice, which were not treated with antibiotics (control mice), are also shown in Fig. 3 and Extended Data Fig. 8q–y. The data were validated at least in two or three experiments. kr, Effects of HFD and immunological background on mouse intestinal microbiomes and metabolomes (total mouse number n = 288). Each dot represents one mouse. k, The most pronounced differences are engendered by HFD compared with normal chow. Left to right: principal coordinate analysis (PCoA) plot of microbiome data using unweighted UniFrac distances (PERMANOVA, pseudo-F statistic = 46, P = 0.001 comparing diet); barchart of relative abundances of bacterial phyla; principal component analysis plot of metabolome. k, l, Subsequent effect of immune status for the MUP-uPA HFD-fed mice: WT, Iga−/−, Cd8a−/−, μMT−/−, and Rag1−/− groups. l, Left to right: PCoA plot of microbiome data using unweighted UniFrac distances (PERMANOVA, pseudo-F statistic = 4.37, P = 0.001 comparing immune status); principal component analysis plot of metabolome; partial least squares discriminant analysis (PLS-DA) plot (the tenfold cross validation Q2 value was 0.817) of metabolome. Large differences between categories are evident. Subsequent juxtaposition of the (m) MUP and MUP;Iga−/−: PCoA of plot of microbiome using unweighted UniFrac distances (PERMANOVA, pseudo-F statistic = 7.31, P = 0.001 comparing immune status) (left); PLS-DA (the tenfold cross validation Q2 value of 0.926) plot of metabolome (right) and (n) MUP and MUP;Cd8a−/−: PCoA plot of microbiome data using unweighted UniFrac distances (PERMANOVA, pseudo-F statistic = 4.61, P = 0.001 comparing immune status) (left); PLS-DA plot (the tenfold cross validation Q2 value of 0.934) plot of metabolome (right) illustrates the discordance stemming from these specific immune status differences. o, Bacterial Faith’s phylogenetic diversity metric (alpha diversity, box plot with minimum to maximum) calculated with rarefaction at 4,500 sequences per sample using Faith’s phylogenetic diversity metric (n = 14, 8, 14, 25, 16, 6, 44, 34). p, Heat map of abundant bacterial taxa by immune status, genetic background, and diet. Trends in significantly differing taxa (ANCOM) by immune status include increased Gammaproteobacteria in Iga−/− with HFD and increased Ruminococcaceae in WT versus Iga−/− with HFD. Mucispirillum schaedleri was elevated in Iga−/− for all groups except normal-chow-fed MUP-uPA. q, Discordance according to the immune status for the STAM model mice. Left to right: PCoA plot of microbiome data using unweighted UniFrac distances; principal component analysis plot of metabolome (the tenfold cross validation Q2 value of the corresponding partial least squares discriminant analysis is 0.814). r, Box plot (minimum to maximum) of unweighted UniFrac distances comparing distances within Iga−/−, Pigr−/−, and IgHEL/MD4 strains with distances between these strains (n = 44, 40, 56) and WT or Cd8a−/− STAM mice (n = 16, 12, 12) for microbiome data. Two-sided t-test (means ± s.e.m.; a, b, i, r) and Mann– Whitney test (median; c–h, j, o) were used to determine significance. * P < 0.05; * * P < 0.01; * * * P < 0.001. N values for each group are shown either in individual panels or in legends for each group from left to right accordingly.
Extended Data Figure 8
Extended Data Figure 8. IgA+ plasmocytes regulate tumour killing by CD8+ T cells
a, Dih10 and dihXY HCC cells were transfected with an inducible ovalbumin (Ova) expression vector, and Ova expression and presentation were confirmed by flow cytometry, using an antibody that recognized the SIINFEKL peptide on the MHCI molecule H-2Kb. bh, Ova-expressing dih cells or controls (dih–RFP) were starved overnight (5% cell death), after which their medium was changed and B cells from WT, Iga−/−, Pdl1/2−/−, or SW-HEL mice were added in the presence of TGFβ (5 ng ml−1) and CTGF (3 ng ml−1), for an additional 24 h. Thereafter, the medium was replaced and CFSE-labelled OT-I T cells were added to the cultures that either contained or did not contain the B cells described above. After 4–6 days, the co-cultured cells were analysed by flow cytometry, while the secretory IgA was analysed by ELISA (n = 2–4 wells per group per day). aj, Experiments were repeated with two different Ova-expressing HCC and one prostate cancer cell lines. Shown are the representative flow cytometry histograms or plots depicting (b) OT-I CD8+ T-cell proliferation, (c) PD-L1 and SIINFEKL/H-2Kb expression on cancer cells, (d) PD-L1 expression on B cells, (e) cancer cell death. f, Relative dih-Ova–RFP killing by OT-I CD8+ T cells in the presence or absence of the indicated B cells. g, Total secretory IgA and anti-OVA-IgA antibody amounts in culture supernatants. h, Percentages of OT-I CD8+ cells in each culture, as indicated. i, j, TRC2-Ova–RFP cells or its control cell line (TRC2–RFP) were co-cultured with OT-I cells and splenic B cells (WT and Il10−/−), as described for ah. i, Proliferation of OT-I cells was analysed using CFSE (n = 3, 7, 5, 4). j, The amounts of secretory IgA were analysed using ELISA as indicated (n = 3 per group). ko, Liver cells from indicated 3-month-old mice were stained and analysed by flow cytometry. Experiments were repeated at least two or three times. Each dot represents one mouse. Shown are the percentage of CD8+ T cells among CD45+ cells (n = 6, 5, 3, 7, 4) (k), absolute CD8+ T-cell number per gram of liver (n = 3, 3, 7, 4) (l), the percentage of CD8+CD44+Ki-67+ T cells with representative scatter plots (n = 3 or 4 per group) (m, n), and the representative scatter plots of perforin and GrzB among CD8+CD44+Ki-67+ T cells (o). p, q, Liver cell suspensions from the indicated mice were stained as shown and analysed by flow cytometry to determine the absolute CD8+ T-cell number in both STAM-BL6 and STAM-FVB mice (n = 8, 4, 5, 3, 5, 5, 6, 7) (p), and the percentage of TEM cells using CD8, CD44, and CD62L (n = 4, 4, 6, 9) (q). r, Liver cells from indicated 3-, 6-, and 11-month-old mice kept on HFD (n = 4–10) were stained and analysed by flow cytometry. Shown are the percentage of CD8+IFNγ +CD107a+ T cells. Detailed n values are shown in Fig. 3e. sy, Liver cell suspensions from the indicated mice were stained as shown and analysed by flow cytometry to determine the percentage of Th17 cells using CD4 and IL-17a (n = 4, 7, 9, 10, 4, 9, 11) (s), the percentage of regulatory T cells using CD4 and Foxp3 (n = 4, 3, 8, 11, 7, 13) (t), the percentage of Tfh-like cells using CXCR5, PD1 and CD4 (3, 5, 6, 5) (u), the percentage of B220+CD19+ B cells (n = 4, 7, 7, 4, 5, 3, 9, 3, 11) (v), absolute B220+CD19+ B-cell number per gram of liver (n = 5, 7, 12, 27, 15, 7) (w), the percentage of IgG+ cells (n = 4, 3, 14, 11) (x), and CD138+ plasma cells (n = 4, 7, 4, 7, 7, 8, 5, 8, 6, 6, 13, 27, 17) (y). Two-sided t-test (means ± s.e.m.; fm) and Mann–Whitney test (median; py) were used to determine significance. * P < 0.05; * * P < 0.01; * * * P < 0.001. Mouse ages are indicated in the graphs. N values for each group in each panel are provided from left to right accordingly.
Extended Data Figure 9
Extended Data Figure 9. The response to PD-L1 blockade is dependent on CD8+ T cells and clonal expansion of HCC-directed CD8+ T cells
MUP-uPA and MUP-uPA/Iga−/− mice were placed on HFD and treated with anti-PD-L1, as described in Extended Data Fig. 2a. a, At the end of the treatments, mouse weights were measured (n = 3, 2, 4, 3, 3, 7, 3, 7). b, MUP-uPA mice treated with anti-PD-L1 were analysed for serum IgA by ELISA (n = 10, 6). c, Liver/body weight ratio of indicated strains kept on HFD that received the indicated treatments and were of the indicated ages (6 months, 11 months) (n = 4, 6, 9, 19, 6, 2, 4, 15, 11, 17, 3, 14, 7, 20). d, e, Paraffin-embedded and frozen liver sections from HCC-bearing MUP-uPA mice were stained with Oil Red O, haematoxylin and eosin, or Sirius Red and analysed (n = 4 or 5). The experiments were repeated at least two times. Low and high magnifications are shown in e to demonstrate the absence of tumour-invading immune cells in a mouse that failed to respond to anti-PD-L1 and their presence within a tumour of a treatment responsive mouse. Non-responsiveness to anti-PD-L1 treatment correlates with a fibrotic tumour stroma. Scale bars: haematoxylin and eosin, 250 μm; Sirius Red, 250 μm; Oil Red O, 50 μm. f, Response to PD-L1 blockade is dependent on CD8+ T cells. HCC-bearing MUP-uPA/Cd8a−/− mice (n = 3) were treated with anti-PD-L1 for 8 weeks and tumour multiplicity was determined. g, Two-dimensional plot showing the frequency of the top ten TCRα CDR3 sequences expressed by CD8+ T cells from spleens and livers of HCC-bearing MUP-uPA mice. h, CD8+ T cells were sorted from spleens and livers of normal-chow- and HFD-fed WT mice (n = 5 mice), their RNA was extracted, and TCR α-chain (top) and β-chain (bottom) CDR3 sequences were amplified and analysed by deep sequencing (ten samples). The panels show the clonality, the frequency of the top 50 TCR α- and β-chain sequences, and the percentage of productive unique TCR α - and β-chain sequences. ik, CD8+ T cells were sorted from spleens and livers of HCC-bearing mice of the indicated strains and treatments (n = 13 mice, 26 samples as indicated) and their TCR α - and β-chain CDR3 sequence diversity was analysed. Shown are the clonality (i), the diversity (inverse Simpson’s index) (j), and percentage of productive unique TCR β-chain sequences in the indicated strains (k). Note that TCR sequencing data of WT, MUP-uPA, and MUP-uPA/Iga−/− mice are also shown in Fig. 4g, h and Extended Data Fig. 9h. ln, Splenocytes from the indicated mice treated with or without anti- PD-L1 were stimulated overnight with alpha-fetoprotein, stained as indicated, and analysed by flow cytometry. Shown are the percentage of IFNγ +CD107a+ cells (n = 3, 3, 2, 5, 3, 2, 3, 4, 4) (l) and IFNγ +TNF+ cells (n = 4, 3, 5, 4) (m) gated on CD8+ T cells. n, The percentage of IFNγ +TNF+ cells gated on CD4+ T cells (n = 3, 3, 2, 4, 3, 2, 3, 6, 4). Two-sided t-test (ad, f, hn) and Mann–Whitney test (l) were used to determine significance. * P < 0.05; * * P < 0.01; * * * P < 0.001. N values for each group in each panel are provided from left to right accordingly.
Extended Data Figure 10
Extended Data Figure 10. Liver-IgA+ cells are oligoclonal, and effects of HFD on control WT, Iga−/−, and Cd8a−/− mice
a, b, B cells and plasmocytes (CD19+, CD138+, IgA+ cells) were sorted from spleens (n = 3) and livers (n = 3) of HCC-bearing MUP-uPA mice and their μ (IgM) and α (IgA) locus genetic diversities were determined by BCR sequencing. c, Circulating ALT in HFD-fed WT, Iga−/−, and Cd8a−/− mice at 6 months of age (n = 5, 4, 8). df, Paraffin-embedded and frozen liver sections from the above mice were stained with haematoxylin and eosin, Oil Red O, or Sirius Red, as indicated. The data were validated at least twice. Scale bars: haematoxylin and eosin, 100 μm; Sirius Red, 100 μm; Oil Red O, 50 μm. The Sirius Red (n = 3, 4, 8) (d) and Oil Red O (n = 3, 3, 6) (e) stained areas were quantitated. gi, Serum cholesterol (g), serum triglycerides (h), and liver triglycerides (i) were measured (n = 5, 4, 3). Two-sided t-test (a, di) and Mann–Whitney test (c) were used to determine significance. * P < 0.05; * * P < 0.01; * * * P < 0.001. N values for each group in each panel are provided from left to right accordingly.
Figure 1
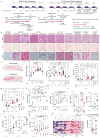
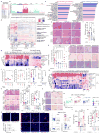
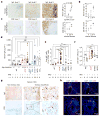
Figure 1. NASH-induced IgA+ plasmocyte accumulation in human and mouse liver
a, c, Liver biopsies from patients with NASH/NAFLD (n = 18) stained for IgA and CD8. Staining intensity was graded from 0 to 3 and plotted against serum IgA (a) or Kleiner fibrosis scores (c). The data were validated in 2 different experiments. b, Serum and liver IgA concentrations (immunohistochemistry scores) plotted against Kleiner fibrosis scores, and were further validated in two different human cohorts (n = 502 and 96; Extended Data Fig. 1a, b). d, Mice of indicated genotypes, ages, and treatments were analysed for serum IgA (n = 4–20). e, f, Liver IgA+ cell (percentage and absolute cell numbers) in different mouse strains and treatment groups (n = 6–31). g, Representative images of paired human non-tumour liver and tumour sections (n = 4) stained for IgA and CD8. h, STAM-B6 liver sections were stained for CD3, CD8, and IgA, and counterstained with DAPI (4′,6-diamidino-2-phenylindole; n = 3). Scale bars, 25–75 μm. Arrows indicate IgA+ and CD3+CD8+ cells in g, h. The data were validated at least in two or three experiments. Linear regression analysis was used to determine the correlation between serum IgA and IgA immunohistochemistry score (a). One-way analysis of variance (ANOVA; means ± s.e.m.; b, c), two-sided t-test (means ± s.e.m.; d), and Mann– Whitney test (median; e, f) were used to determine significance. * P < 0.05; * * P < 0.01; * * * P < 0.001; NS, not significant. Specific n values are shown in df.
Figure 2
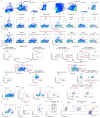
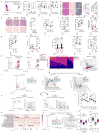
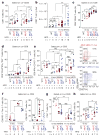
Figure 2. IgA ablation inhibits while CD8a ablation accelerates HCC appearance
a, Splenic and liver cells from the indicated mice (n = 3–12) were stained after ex vivo stimulation and analysed by flow cytometry. % of IgA+ cells expressing IL-10 and PD-L1. b, c, Splenic, liver, and intestinal cells from Il10-GFP/MUP-uPA mice (n = 6–12) were stained and analysed by flow cytometry. b, Representative flow cytometry analysis of Il10-GFP expression in liver B cells and plasma cell subpopulations. c, Representative flow cytometry plots and percentage of GFP+ cells in IgA+ subpopulations. d, Mutated genes in human HCC on the basis of the COSMIC Database and MUP-uPA-HFD mice are compared. Driver genes are marked with red asterisks. e, Representative gross liver morphology and large tumour (T) incidence (> 0.4 cm) at different time points. f, g, Tumour numbers (n = 4–31) (f) and volumes (n = 9–38) (g) in 11-month-old HFD-fed MUP-uPA mice. When indicated, mice were treated with broad spectrum antibiotics (Abx) from 6 to 11 months. h, i, Tumour multiplicity in indicated BL6 (h) or FVB (i) STAM mice was determined at 25 or 20 weeks of age, respectively (n = 3–19). Experiments were repeated at least three times. STAM-Iga−/− mice were injected weekly with anti-CD8 (n = 3) for 5 weeks. j, Splenocytes from WT-BL6 (T+ B cells) or μMT−/− (T cells) mice were transferred into MUP-uPA/Rag1−/− mice (n = 4 per transfer). After 1 month, tumour numbers and volumes were determined. Experiments were performed twice. Tumour volumes (g, j, right) are plotted logarithmically, and minima to maxima with all points are shown. Two-sided t-test (means ± s.e.m.; j, left) and Mann–Whitney test (median; a, c, fi, j, right) were used to determine significance. * P < 0.05; * * P < 0.01; * * * P < 0.001. Specific n values are shown in a, c, fj, and Supplementary Tables 1 and 2.
Figure 3
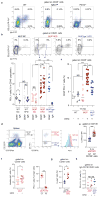
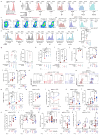
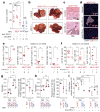
Figure 3. Liver IgA+ cells induce CD8+ T-cell exhaustion
af, Liver cells from indicated 3-, 6-, and 11-month (mo)-old mice (n = 3–18 per group) were stained and analysed by flow cytometry. The percentage of CD8+ T cells (a), absolute CD8+ T-cell number per gram of liver (b), and the percentage of CD44+CD8+ effector T cells (c). d, e, Liver CD8+ T cells from the indicated mice (n = 3–10) were stimulated with phorbol 12-myristate 13-acetate (PMA)/ionomycin medium and stained as indicated. The percentage of CD8+ T cells positive for CD44, IFNγ, and TNF (d), and IFNγ and CD107a (e). f, The percentage of CD8+Tim- 3+PD-1+ T cells at 6 and 11 months (left), and PD-1+ T cells at 11 months (right). g, h, Liver cell suspensions were stained for CD4 (g) and CD4 and IFNγ (h). The gating scheme is indicated above each panel. The data were validated in at least three independent experiments. Two-sided t-test (means ± s.e.m.; f, left) and Mann–Whitney test (median; ah, f, right) were used to determine significance. * P < 0.05; * * P < 0.01; * * * P < 0.001. Specific n values are shown in panels.
Figure 4
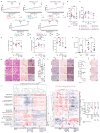
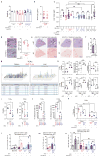
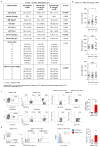
Figure 4. PD-L1 blockade reactivates and expands antigen-specific CD8+ T cells to induce HCC regression
Tumour-bearing MUP-uPA mice (n = 7–10) were given weekly injections for 8 consecutive weeks of blocking (anti-PD-L1) or control (LALAPG) PD-L1 antibodies or left untreated. ac, Tumour number (a), representative gross liver morphology (b), and tumour histology (c). H&E, haematoxylin and eosin. Arrow in c shows a typical inflammatory infiltrate (scale bars, 100 μm). d, Liver sections were stained for CD3 and CD8 and examined by fluorescence microscopy (scale bars, 50 μm). Experiments were repeated at least two or three times. e, f, Liver CD45+ cells were stained as indicated and analysed by flow cytometry. g, h, CD8+ T cells were sorted from spleens and livers of indicated mice (n = 9) and sequenced for TCR α - (g) and β - (h) chain CDR3 region (18 samples). Panels show clonality and frequency of top 50 TCR α - and β-sequences. i, Similar analysis was performed on CD8+ T cells from spleens and livers of anti-PD-L1-treated (eight samples) or control (−) HCC-bearing mice. Panel shows the percentage of productive unique TCRα sequences. Two-sided t-test (means ± s.e.m.; gi) and Mann–Whitney test (median; a, e, f) were used to determine significance. * P < 0.05; * * P < 0.01; * * * P < 0.001; Specific n values are shown in a, e, f.

Comment in

Similar articles

  • NASH limits anti-tumour surveillance in immunotherapy-treated HCC.
    Pfister D, Núñez NG, Pinyol R, Govaere O, Pinter M, Szydlowska M, Gupta R, Qiu M, Deczkowska A, Weiner A, Müller F, Sinha A, Friebel E, Engleitner T, Lenggenhager D, Moncsek A, Heide D, Stirm K, Kosla J, Kotsiliti E, Leone V, Dudek M, Yousuf S, Inverso D, Singh I, Teijeiro A, Castet F, Montironi C, Haber PK, Tiniakos D, Bedossa P, Cockell S, Younes R, Vacca M, Marra F, Schattenberg JM, Allison M, Bugianesi E, Ratziu V, Pressiani T, D'Alessio A, Personeni N, Rimassa L, Daly AK, Scheiner B, Pomej K, Kirstein MM, Vogel A, Peck-Radosavljevic M, Hucke F, Finkelmeier F, Waidmann O, Trojan J, Schulze K, Wege H, Koch S, Weinmann A, Bueter M, Rössler F, Siebenhüner A, De Dosso S, Mallm JP, Umansky V, Jugold M, Luedde T, Schietinger A, Schirmacher P, Emu B, Augustin HG, Billeter A, Müller-Stich B, Kikuchi H, Duda DG, Kütting F, Waldschmidt DT, Ebert MP, Rahbari N, Mei HE, Schulz AR, Ringelhan M, Malek N, Spahn S, Bitzer M, Ruiz de Galarreta M, Lujambio A, Dufour JF, Marron TU, Kaseb A, Kudo M, Huang YH, Djouder N, Wolter K, Zender L, Marche PN, Decaens T, Pinato DJ, Rad R, Mertens JC, Weber A, Unger K, Meissner F, Roth S, Jilkova ZM, Claassen M, Anstee QM, Amit I, Knolle P, Becher B, Llovet… See abstract for full author list ➔ Pfister D, et al. Nature. 2021 Apr;592(7854):450-456. doi: 10.1038/s41586-021-03362-0. Epub 2021 Mar 24. Nature. 2021. PMID: 33762733 Free PMC article.
  • Liver fibrosis promotes immune escape in hepatocellular carcinoma via GOLM1-mediated PD-L1 upregulation.
    Ke MY, Xu T, Fang Y, Ye YP, Li ZJ, Ren FG, Lu SY, Zhang XF, Wu RQ, Lv Y, Dong J. Ke MY, et al. Cancer Lett. 2021 Aug 10;513:14-25. doi: 10.1016/j.canlet.2021.05.007. Epub 2021 May 14. Cancer Lett. 2021. PMID: 33992711
  • [Non alcoholic-fatty liver disease causes selective CD4+ T lymphocytes loss and promotes hepatocarcinogenesis].
    L'Hermitte A, Pham S, Cadoux M, Couty JP. L'Hermitte A, et al. Med Sci (Paris). 2016 Nov;32(11):1023-1026. doi: 10.1051/medsci/20163211021. Epub 2016 Dec 23. Med Sci (Paris). 2016. PMID: 28008846 French. No abstract available.
  • Neutrophil: An emerging player in the occurrence and progression of metabolic associated fatty liver disease.
    Chen S, Guo H, Xie M, Zhou C, Zheng M. Chen S, et al. Int Immunopharmacol. 2021 Aug;97:107609. doi: 10.1016/j.intimp.2021.107609. Epub 2021 Apr 19. Int Immunopharmacol. 2021. PMID: 33887577 Review.
  • Adaptive immunity: an emerging player in the progression of NAFLD.
    Sutti S, Albano E. Sutti S, et al. Nat Rev Gastroenterol Hepatol. 2020 Feb;17(2):81-92. doi: 10.1038/s41575-019-0210-2. Epub 2019 Oct 11. Nat Rev Gastroenterol Hepatol. 2020. PMID: 31605031 Free PMC article. Review.

Cited by

References

    1. Sharma P, Wagner K, Wolchok JD, Allison JP. Novel cancer immunotherapy agents with survival benefit: recent successes and next steps. Nat Rev Cancer. 2011;11:805–812. - PMC - PubMed
    1. Rosenberg SA, Restifo NP. Adoptive cell transfer as personalized immunotherapy for human cancer. Science. 2015;348:62–68. - PMC - PubMed
    1. Mittal D, Gubin MM, Schreiber RD, Smyth MJ. New insights into cancer immunoediting and its three component phases — elimination, equilibrium and escape. Curr Opin Immunol. 2014;27:16–25. - PMC - PubMed
    1. Corthay A. Does the immune system naturally protect against cancer? Front Immunol. 2014;5:197. - PMC - PubMed
    1. Singal AG, El-Serag HB. Hepatocellular carcinoma from epidemiology to prevention: translating knowledge into practice. Clin Gastroenterol Hepatol. 2015;13:2140–2151. - PMC - PubMed

Publication types

MeSH terms