. 2018 Feb;42(2):315-328.
doi: 10.1111/acer.13554. Epub 2017 Dec 27.

The Mammalian Circadian Clock Exhibits Chronic Ethanol Tolerance and Withdrawal-Induced Glutamate Hypersensitivity, Accompanied by Changes in Glutamate and TrkB Receptor Proteins

Affiliations

The Mammalian Circadian Clock Exhibits Chronic Ethanol Tolerance and Withdrawal-Induced Glutamate Hypersensitivity, Accompanied by Changes in Glutamate and TrkB Receptor Proteins

Jonathan H Lindsay et al. Alcohol Clin Exp Res. 2018 Feb.

Abstract

Background: Alcohol tolerance and withdrawal-induced effects are criteria for alcohol use disorders listed by the DSM-V. Although tolerance and withdrawal have been studied over many decades, there is still uncertainty regarding mechanistic distinctions that characterize these different forms of ethanol (EtOH)-induced plasticity. Previously, we demonstrated that the suprachiasmatic nucleus (SCN) circadian clock develops both acute and rapid tolerance to EtOH inhibition of glutamate-induced circadian phase shifts. Here, we demonstrate that chronic EtOH tolerance and withdrawal-induced glutamate hypersensitivity occur in vitro and that rapid tolerance, chronic tolerance, and glutamate hypersensitivity have distinct cellular changes.

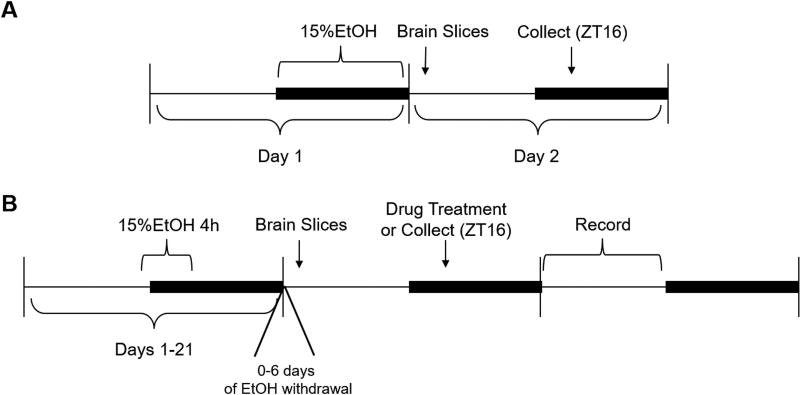
Methods: We use single-unit extracellular electrophysiological recordings to determine whether chronic tolerance to EtOH inhibition of glutamatergic phase shifts and withdrawal-induced glutamate hypersensitivity develop in the SCN. We use Western blotting to compare phosphorylation state and total expression of N-methyl-D-aspartate (NMDA) receptor subunits and associated proteins in the SCN after mice were exposed to varying EtOH consumption paradigms.

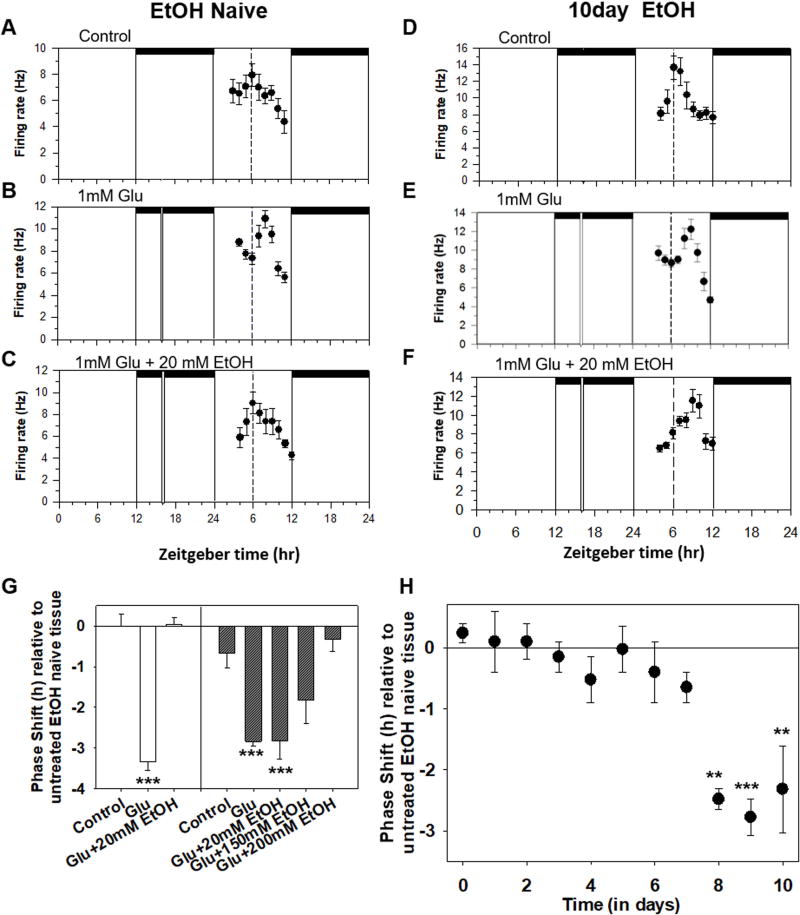
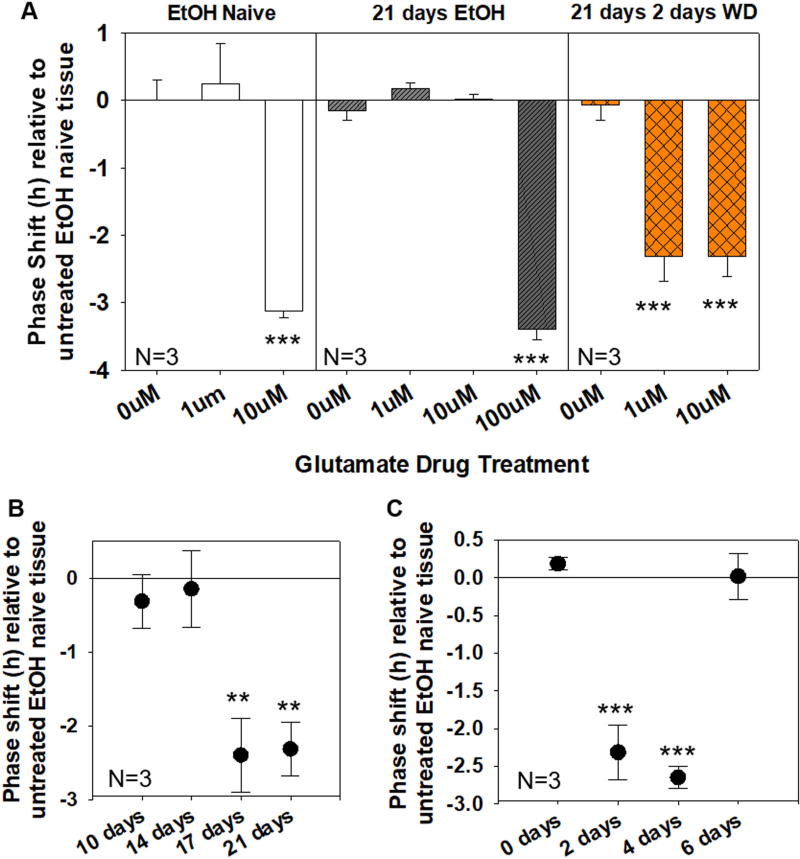
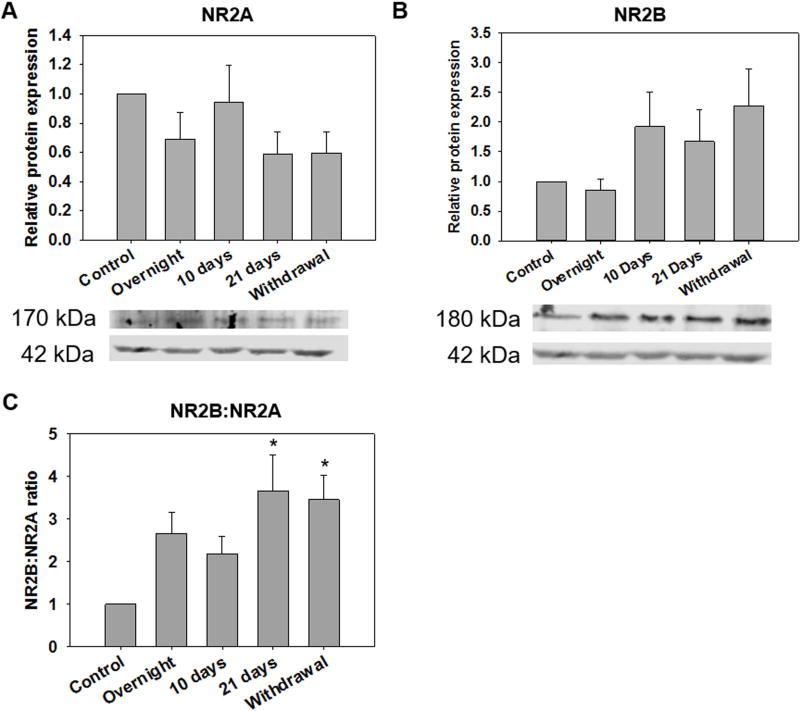
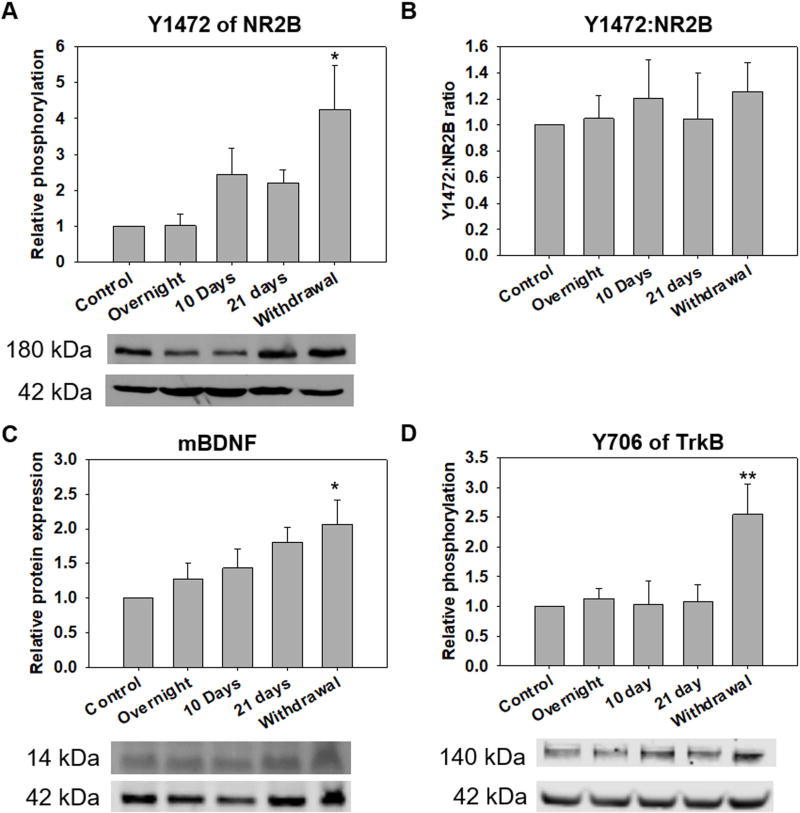
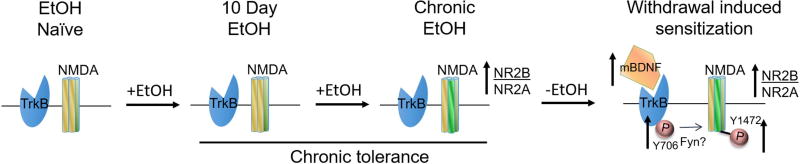
Results: Chronic tolerance developed after a minimum of 8 days of 4 h/d EtOH access, as indicated by a decreased sensitivity to EtOH inhibition of glutamate-induced phase shifts. We also observed an increased sensitivity to glutamate-induced phase shifts in SCN tissue following withdrawal. We demonstrated an increase in the ratio of NR2B:NR2A NMDA receptor subunit expression after 21 days, but not after 10 days of EtOH drinking. This increase persisted during EtOH withdrawal, along with an increase in NR2B Y1472 phosphorylation, mature brain-derived neurotrophic factor, and phosphorylated TrkB.

Conclusions: These results demonstrate that multiple tolerance forms and withdrawal-induced glutamate hypersensitivity occur in the SCN and that these different forms of EtOH-induced plasticity are accompanied by distinct changes in cellular physiology. Importantly, this study further demonstrates the power of using the SCN as a model system to investigate EtOH-induced plasticity.

Keywords: Brain-Derived Neurotrophic Factor; Circadian Rhythms; NMDA; Tolerance; TrkB; Withdrawal.


Figures

Figure 1
Figure 1
Experimental protocols. A) For rapid tolerance protocol, mice were allowed overnight access to 15% ethanol (EtOH) on Day 1. At lights-on of Day 2, mice were sacrificed and suprachiasmatic nucleus (SCN) brain slices were prepared. At Zeitgeber Time (ZT) 16, brain slices were collected and flash frozen for Western blot assays. B) Chronic tolerance and EtOH withdrawal protocols. For chronic tolerance protocol, mice were allowed 4h access to 15% ethanol (EtOH) starting one hour prior to lights out and ending three hours after lights out for up to 21 days. At lights-on of the last day, mice were sacrificed and SCN brain slices were prepared. At ZT16, brain slices received bath-applied drug treatment or were collected and flash frozen for Western blot assays. For drug treatments, the treatment was removed after 10 minutes, and slices were left undisturbed until the next day. The following electrophysiological recordings of SCN neuronal activity were conducted. For the EtOH withdrawal protocol, mice are allowed 4h access to 15% EtOH for up to 21 days. Following this, mice were allowed access only to water for 2–6 days. At lights-on of the final day of EtOH withdrawal, mice were sacrificed and SCN brain slices were prepared. SCN tissue underwent either electrophysiology or western blotting procedures as described above.
Figure 2
Figure 2
Chronic tolerance to ethanol (EtOH) inhibition of glutamate-induced phase delays. (A-F) Shown are the 2-hour mean ± SEM of suprachiasmatic nucleus neuronal activity obtained in individual experiments. (A) Extracellular electrophysiological recordings in SCN tissue from an EtOH naïve mouse with no drug treatment shows a peak at Zeitgeber time (ZT) 6. (B) A 10 min bath application of 1mM glutamate (Glu) at ZT16 to SCN tissue from an EtOH naïve mouse induced a 2 hour phase delay. (C) Co-application of 20mM EtOH with 1mM glutamate blocked the glutamate induced phase delay in SCN tissue from an EtOH naïve mouse, indicating that the Glu-induced phase delay was inhibited. (D) In a control experiment with SCN tissue from a mouse given daily 4 h EtOH access for 10 days, neuronal activity peaked at ZT6, similar to that shown in A. (E) A 10 min bath application of 1mM Glu at ZT16 to SCN tissue from an EtOH exposed mouse induced ~ a 2.5 hour phase delay, similar to that shown in B. (F) Co-application of 20mM EtOH and 1mM Glu did not inhibit the Glu induced phase shift in SCN slices from a mouse that had undergone the chronic EtOH protocol for 10 days. Horizontal bars: time of lights-off in the animal colony; vertical bars: time of drug treatment(s); dotted line: mean time of peak in control experiments. (G) Shown are the mean ± SEM phase shifts induced by glutamate and EtOH treatments applied to brain slices of EtOH naïve mice and mice after 10 days of the chronic EtOH protocol. In SCN slices from EtOH naïve mice, Glu induced significant phase delays that were blocked by 20 mM EtOH. In SCN tissue from chronic EtOH mice, Glu induced significant delays that were not blocked by either 20 or 150 mM EtOH, but were blocked by 200 mM EtOH. (n=3 for each treatment). (H) Plotted are the mean (± SEM) phase shifts induced by 1mM Glu + 20mM EtOH applied to brain slices prepared from mice given access to 15% EtOH for varying numbers of days. 20mM EtOH was able to completely inhibit Glu induced phase shifts after mice had been exposed to 0–7 days of chronic EtOH, no longer inhibited Glu-induced phase shifts after mice had been given access to EtOH for 8 or more days. One-way ANOVA indicated a significant effect of treatment, *Post-hoc (Holm-Sidak) test indicates p < 0.05 versus control experiments. *** p < 0.001
Figure 3
Figure 3
SCN circadian clock sensitization to glutamate phase resetting after EtOH withdrawal. (A) Plotted are the mean (± SEM) phase delays induced by 0 uM, 1 uM, and 10 uM glutamate in SCN tissue from EtOH naïve mice (white bars, n=3), mice given access to EtOH (4 h/day) for 21 days (gray bars, n=3), and mice given access to EtOH for 21 days followed by two days of EtOH withdrawal (orange bars, n=3). ***Post-hoc (Holm-Sidak) test indicates p < 0.001 versus tissue fromcontrol EtOH naïve mice. (B) Plotted are the mean (± SEM) phase delays induced by 1uM glutamate treatment applied to SCN tissue from mice that had undergone 2 days of EtOH withdrawal after varying numbers of days of chronic drinking. **Post-hoc (Holm-Sidak) test indicates p < 0.01 versus tissue from control EtOH naïve mice. (C) Plotted are the mean (± SEM) phase delays induced by 1uM glutamate treatment applied to SCN tissue from mice that had undergone varying durations of EtOH withdrawal after 21 days of chronic drinking. **Post-hoc (Holm-Sidak) test indicates p < 0.001 versus 0uM glutamate EtOH naïve control.
Figure 4
Figure 4
Protein expression of NMDA NR2B and NR2A subunits in the SCN after rapid, chronic 10 days, chronic 21 days, and EtOH withdrawal procedures. (A) Above, plotted are the mean band densities (± SEM) for NR2A normalized to control tissue and relative to actin (n=7 for all conditions). Below are representative images for NR2A (170 kDa) and actin (42 kDa) bands across all treatments. (B) Above, plotted are the mean band densities (± SEM) for NR2B normalized to control tissue relative to actin (n=7 for chronic 21 days group; n=11 for all other groups). Below are representative images for NR2B (180 kDa) and actin bands across all treatments, respectively. (C) Plotted are the mean ratios of band densities for NR2B to NR2A normalized to control tissue and relative to actin (n=7 for all conditions). The same blot was stripped and re-probed for either NR2B or NR2A so comparisons of NR2B:NR2A ratios were made within each experimental replicate. *Post-hoc (Holm-Sidak) test indicates p<0.05 versus control experiments.
Figure 5
Figure 5
Protein expression for phosphorylated and total NR2B, mBDNF, and phosphorylated TrkB in the SCN after rapid, chronic 10 days, chronic 21 days, and EtOH withdrawal procedures. (A) Plotted are mean band densities (± SEM) for phosphorylation of the Y1472 residue of NR2B normalized to control tissue and relative to actin across different conditions (n=3 for chronic 21 days, n=8 for other conditions). Below are representative images for phospho-NR2B and actin bands across all treatments, respectively. *Post-hoc (Holm-Sidak) test indicates p<0.05 versus control experiments. (B) Plotted are the mean band densities (± SEM) for the ratio of Y1472 phospho-NR2B to NR2B expression normalized to control tissue and relative to actin (n=6 for all conditions). (C) Above, plotted are mean band densities (± SEM) for mBDNF protein expression normalized to control tissue and relative to actin across all conditions (n=6 for all conditions). Below are representative images for mBDNF (14 kDa) and actin bands across all treatments, respectively *Post-hoc (Holm-Sidak) test indicates p<0.05 versus control experiments. (D) Above, plotted are mean band densities (± SEM) for phosphorylation of the Y706 residue of the TrkB receptor normalized to control tissue and relative to actin across different conditions (n=3 for chronic 21 days; n=8 for other conditions). Below are representative images for phospho-TrkB (140 kDa) and actin bands across all treatments, respectively. **Post-hoc (Holm-Sidak) test indicates p<0.05 versus all conditions.
Figure 6
Figure 6
Model depicting cellular changes associated with chronic EtOH exposure and and EtOH withdrawal occurring in the SCN. After 21 days (but not 10 days) of 4h/day chronic EtOH access, there is an increase in the ratio of NR2B to NR2A NMDA subunits. This change is not necessary for tolerance, which is seen after 10 days of chronic EtOH, so other changes must also be occurring. However, it may be a prerequisite of EtOH withdrawal induced plasticity. During withdrawal, the increase in NR2B:NR2A ratio persists in addition to increases in Y1472 phosphorylation of NR2B subunit. Upstream, increases in mBDNF expression and Y706 phosphorylation of TrkB receptors are also seen. One possibility is that increased TrkB activity promotes NR2B phosphorylation via the Src family kinase, Fyn. These changes may be responsible for the enhanced glutamate sensitivity seen in the SCN after EtOH withdrawal.

Similar articles

Cited by

References

    1. Beckley JT, Laguesse S, Phamluong K, Morisot N, Wegner SA, Ron D. The first alcohol drink triggers mTORC1-dependent synaptic plasticity in nucleus accumbens dopamine d1 receptor neurons. The Journal of neuroscience: the official journal of the Society for Neuroscience. 2016 Jan;36(3):701–713. - PMC - PubMed
    1. Bell RL, Stewart RB, Woods JE, Lumeng L, Li TK, Murphy JM, McBride WJ. Responsivity and development of tolerance to the motor impairing effects of moderate doses of ethanol in alcohol-preferring (p) and -nonpreferring (NP) rat lines. Alcoholism, clinical and experimental research. 2001 May;25(5):644–650. - PubMed
    1. Bradbury MJ, Dement WC, Edgar DM. Serotonin-containing fibers in the suprachiasmatic hypothalamus attenuate light-induced phase delays in mice. Brain Research. 1997 Sep;768(1–2):125–134. - PubMed
    1. Brager AJ, Ruby CL, Prosser RA, Glass JD. Chronic ethanol disrupts circadian photic entrainment and daily locomotor activity in the mouse. Alcoholism: Clinical and Experimental Research. 2010;34(7):1266–1273. - PMC - PubMed
    1. Brager AJ, Prosser RA, Glass JD. Circadian and acamprosate modulation of elevated ethanol drinking in mPer2 clock gene mutant mice. Chronobiology international. 2011 Oct;28(8):664–672. - PMC - PubMed

MeSH terms

LinkOut - more resources