

Evidence for allosteric effects on p53 oligomerization induced by phosphorylation
- PMID: 29124793
- PMCID: PMC5775181
- DOI: 10.1002/pro.3344
Evidence for allosteric effects on p53 oligomerization induced by phosphorylation
Abstract
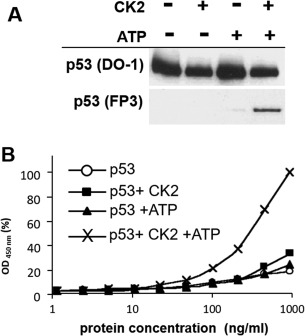
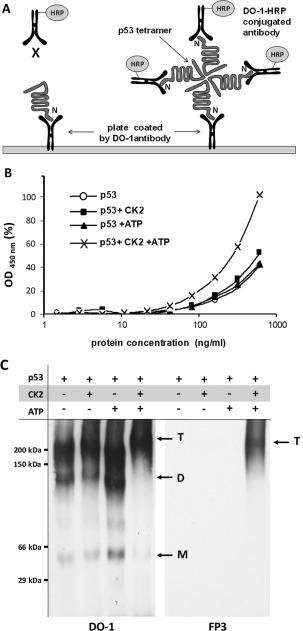
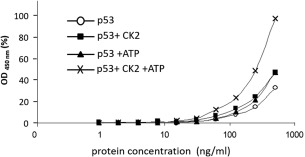
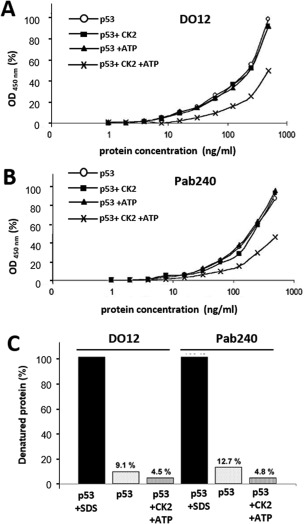
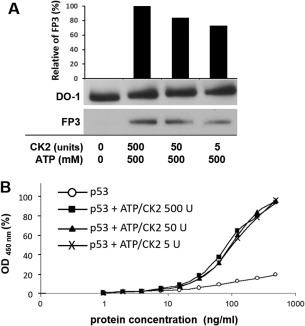
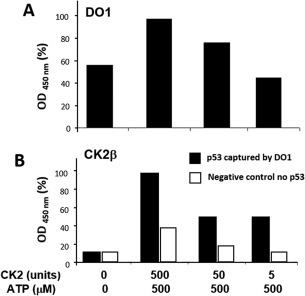
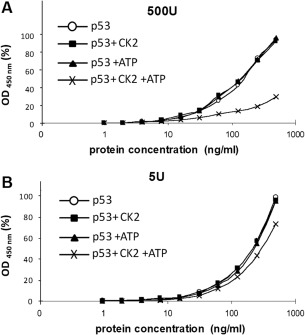
p53 is a tetrameric protein with a thermodynamically unstable deoxyribonucleic acid (DNA)-binding domain flanked by intrinsically disordered regulatory domains that control its activity. The unstable and disordered segments of p53 allow high flexibility as it interacts with binding partners and permits a rapid on/off switch to control its function. The p53 tetramer can exist in multiple conformational states, any of which can be stabilized by a particular modification. Here, we apply the allostery model to p53 to ask whether evidence can be found that the "activating" C-terminal phosphorylation of p53 stabilizes a specific conformation of the protein in the absence of DNA. We take advantage of monoclonal antibodies for p53 that measure indirectly the following conformations: unfolded, folded, and tetrameric. A double antibody capture enzyme linked-immunosorbent assay was used to observe evidence of conformational changes of human p53 upon phosphorylation by casein kinase 2 in vitro. It was demonstrated that oligomerization and stabilization of p53 wild-type conformation results in differential exposure of conformational epitopes PAb1620, PAb240, and DO12 that indicates a reduction in the "unfolded" conformation and increases in the folded conformation coincide with increases in its oligomerization state. These data highlight that the oligomeric conformation of p53 can be stabilized by an activating enzyme and further highlight the utility of the allostery model when applied to understanding the regulation of unstable and intrinsically disordered proteins.
Keywords: CK2; allosteric regulation; conformational change; oligomerization; p53; phosphorylation; protein conformation; protein folding.
© 2017 The Protein Society.
Figures
Similar articles
-
On the mechanism of sequence-specific DNA-dependent acetylation of p53: the acetylation motif is exposed upon DNA binding.J Mol Biol. 2006 Mar 24;357(2):442-56. doi: 10.1016/j.jmb.2005.12.026. Epub 2005 Dec 27. J Mol Biol. 2006. PMID: 16438982
-
Activation of the DNA-binding ability of latent p53 protein by protein kinase C is abolished by protein kinase CK2.Biochem J. 2004 Mar 15;378(Pt 3):939-47. doi: 10.1042/BJ20030662. Biochem J. 2004. PMID: 14640983 Free PMC article.
-
Allosteric regulation of the thermostability and DNA binding activity of human p53 by specific interacting proteins. CRC Cell Transformation Group.J Biol Chem. 1996 Feb 16;271(7):3917-24. doi: 10.1074/jbc.271.7.3917. J Biol Chem. 1996. PMID: 8632013
-
Posttranslational regulation of p53 tumor suppressor protein function.Crit Rev Oncog. 1994;5(1):23-57. doi: 10.1615/critrevoncog.v5.i1.20. Crit Rev Oncog. 1994. PMID: 7948107 Review.
-
Signaling to p53: breaking the posttranslational modification code.Pathol Biol (Paris). 2000 Apr;48(3):227-45. Pathol Biol (Paris). 2000. PMID: 10858956 Review.
Cited by
-
Spontaneous Switching among Conformational Ensembles in Intrinsically Disordered Proteins.Biomolecules. 2019 Mar 22;9(3):114. doi: 10.3390/biom9030114. Biomolecules. 2019. PMID: 30909517 Free PMC article. Review.
-
Single Molecule FRET: A Powerful Tool to Study Intrinsically Disordered Proteins.Biomolecules. 2018 Nov 8;8(4):140. doi: 10.3390/biom8040140. Biomolecules. 2018. PMID: 30413085 Free PMC article. Review.
-
Characterization of p53 Family Homologs in Evolutionary Remote Branches of Holozoa.Int J Mol Sci. 2019 Dec 18;21(1):6. doi: 10.3390/ijms21010006. Int J Mol Sci. 2019. PMID: 31861340 Free PMC article.
-
Wild-type p53 oligomerizes more efficiently than p53 hot-spot mutants and overcomes mutant p53 gain-of-function via a "dominant-positive" mechanism.Oncotarget. 2018 Aug 10;9(62):32063-32080. doi: 10.18632/oncotarget.25944. eCollection 2018 Aug 10. Oncotarget. 2018. PMID: 30174797 Free PMC article.
References
-
- Vogelstein B, Lane D, Levine AJ (2000) Surfing the p53 network. Nature 408:307–310. - PubMed
-
- Fields S, Jang SK (1990) Presence of a potent transcription activating sequence in the p53 protein. Science 249:1046–1049. - PubMed
-
- Bargonetti J, Manfredi JJ, Chen X, Marshak DR, Prives C (1993) A proteolytic fragment from the central region of p53 has marked sequence‐specific DNA‐binding activity when generated from wild‐type but not from oncogenic mutant p53 protein. Genes Dev 7:2565–2574. - PubMed
Publication types
MeSH terms
Substances
LinkOut - more resources
Full Text Sources
Other Literature Sources
Research Materials
Miscellaneous
