

MiR-335 overexpression impairs insulin secretion through defective priming of insulin vesicles
- PMID: 29122960
- PMCID: PMC5688784
- DOI: 10.14814/phy2.13493
MiR-335 overexpression impairs insulin secretion through defective priming of insulin vesicles
Abstract
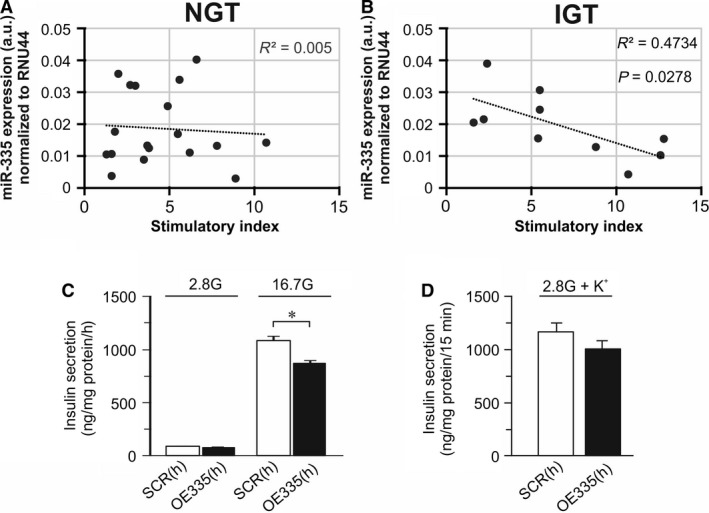
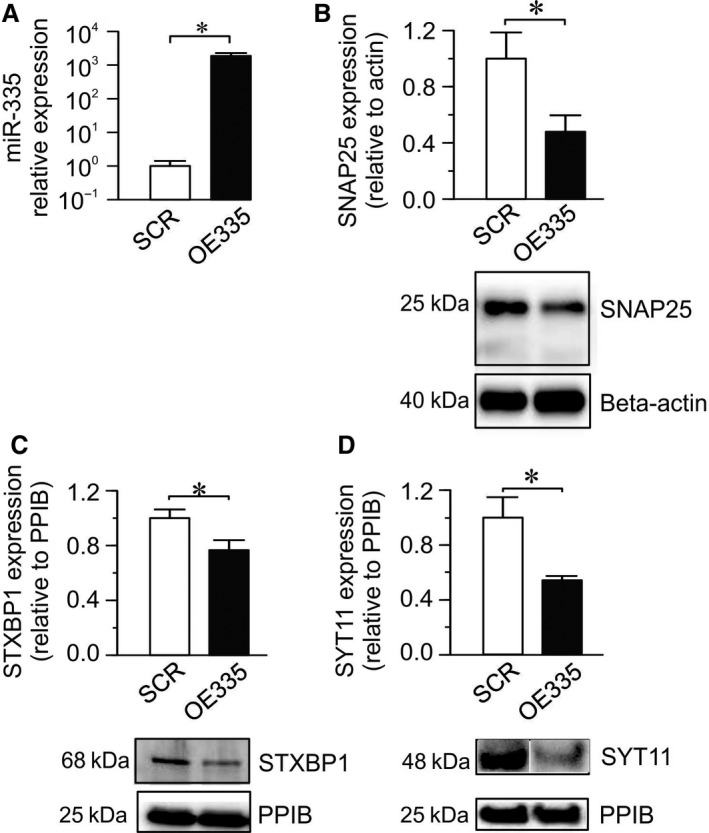
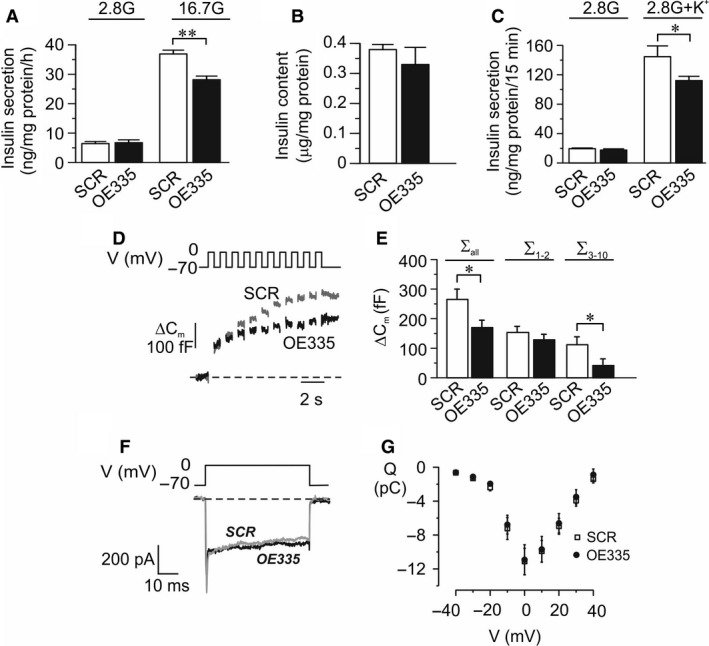
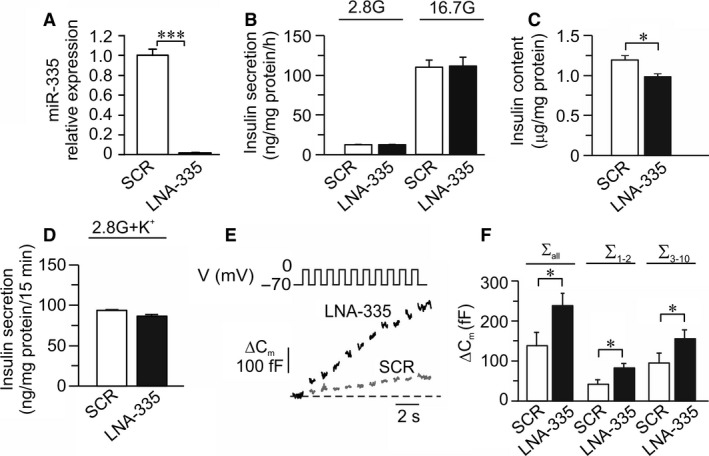
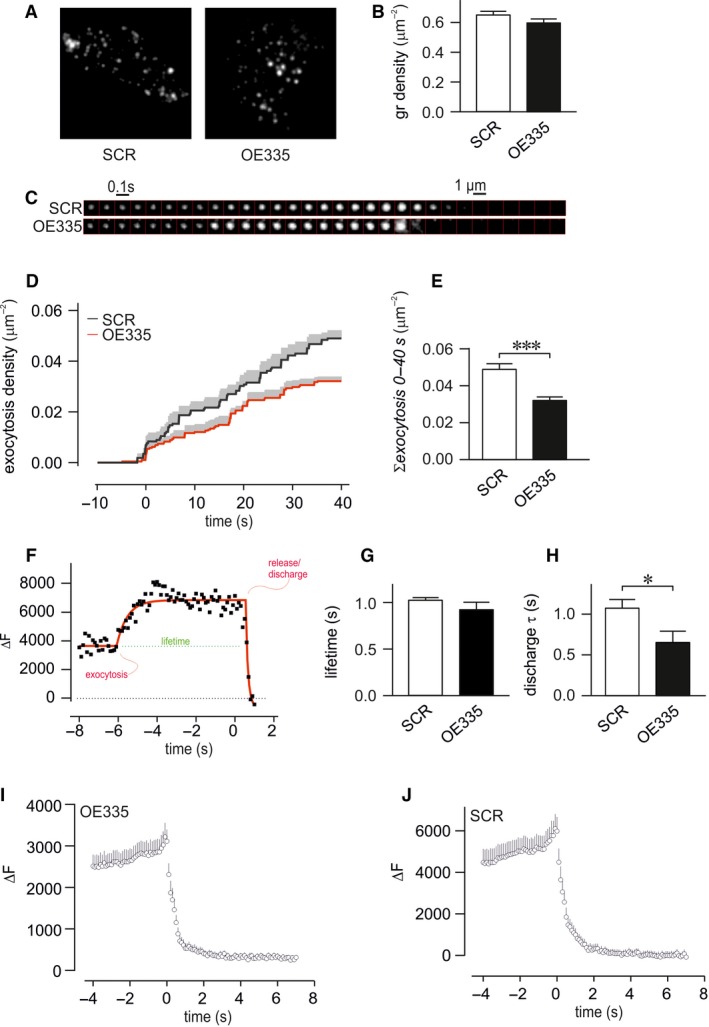
MicroRNAs contribute to the maintenance of optimal cellular functions by fine-tuning protein expression levels. In the pancreatic β-cells, imbalances in the exocytotic machinery components lead to impaired insulin secretion and type 2 diabetes (T2D). We hypothesize that dysregulated miRNA expression exacerbates β-cell dysfunction, and have earlier shown that islets from the diabetic GK-rat model have increased expression of miRNAs, including miR-335-5p (miR-335). Here, we aim to determine the specific role of miR-335 during development of T2D, and the influence of this miRNA on glucose-stimulated insulin secretion and Ca2+-dependent exocytosis. We found that the expression of miR-335 negatively correlated with secretion index in human islets of individuals with prediabetes. Overexpression of miR-335 in human EndoC-βH1 and in rat INS-1 832/13 cells (OE335) resulted in decreased glucose-stimulated insulin secretion, and OE335 cells showed concomitant reduction in three exocytotic proteins: SNAP25, Syntaxin-binding protein 1 (STXBP1), and synaptotagmin 11 (SYT11). Single-cell capacitance measurements, complemented with TIRF microscopy of the granule marker NPY-mEGFP demonstrated a significant reduction in exocytosis in OE335 cells. The reduction was not associated with defective docking or decreased Ca2+ current. More likely, it is a direct consequence of impaired priming of already docked granules. Earlier reports have proposed reduced granular priming as the cause of reduced first-phase insulin secretion during prediabetes. Here, we show a specific role of miR-335 in regulating insulin secretion during this transition period. Moreover, we can conclude that miR-335 has the capacity to modulate insulin secretion and Ca2+-dependent exocytosis through effects on granular priming.
Keywords: TIRF; Beta cell; SNAP25; STXBP1; Type 2 Diabetes; exocytosis; insulin secretion; microRNA; patch‐clamp.
© 2017 The Authors. Physiological Reports published by Wiley Periodicals, Inc. on behalf of The Physiological Society and the American Physiological Society.
Figures
Similar articles
-
Ca2+-secretion coupling is impaired in diabetic Goto Kakizaki rats.J Gen Physiol. 2007 Jun;129(6):493-508. doi: 10.1085/jgp.200609604. J Gen Physiol. 2007. PMID: 17535961 Free PMC article.
-
MicroRNA-124a is hyperexpressed in type 2 diabetic human pancreatic islets and negatively regulates insulin secretion.Acta Diabetol. 2015 Jun;52(3):523-30. doi: 10.1007/s00592-014-0675-y. Epub 2014 Nov 19. Acta Diabetol. 2015. PMID: 25408296
-
Potential Protection Against Type 2 Diabetes in Obesity Through Lower CD36 Expression and Improved Exocytosis in β-Cells.Diabetes. 2020 Jun;69(6):1193-1205. doi: 10.2337/db19-0944. Epub 2020 Mar 20. Diabetes. 2020. PMID: 32198214 Free PMC article.
-
MicroRNAs in islet hormone secretion.Diabetes Obes Metab. 2018 Sep;20 Suppl 2:11-19. doi: 10.1111/dom.13382. Diabetes Obes Metab. 2018. PMID: 30230181 Review.
-
Recent Insights into Beta-cell Exocytosis in Type 2 Diabetes.J Mol Biol. 2020 Mar 6;432(5):1310-1325. doi: 10.1016/j.jmb.2019.12.012. Epub 2019 Dec 19. J Mol Biol. 2020. PMID: 31863749 Free PMC article. Review.
Cited by
-
UTRs and Ago-2/miR-335 Complex Restricts Amylin Translation in Insulinoma and Human Pancreatic β-Cells.Int J Mol Sci. 2024 Sep 5;25(17):9614. doi: 10.3390/ijms25179614. Int J Mol Sci. 2024. PMID: 39273561 Free PMC article.
-
MicroRNAs, Parkinson's Disease, and Diabetes Mellitus.Int J Mol Sci. 2021 Mar 14;22(6):2953. doi: 10.3390/ijms22062953. Int J Mol Sci. 2021. PMID: 33799467 Free PMC article. Review.
-
MicroRNA Networks in Pancreatic Islet Cells: Normal Function and Type 2 Diabetes.Diabetes. 2020 May;69(5):804-812. doi: 10.2337/dbi19-0016. Diabetes. 2020. PMID: 32312896 Free PMC article.
-
miR-29a Negatively Affects Glucose-Stimulated Insulin Secretion and MIN6 Cell Proliferation via Cdc42/β-Catenin Signaling.Int J Endocrinol. 2019 Aug 28;2019:5219782. doi: 10.1155/2019/5219782. eCollection 2019. Int J Endocrinol. 2019. PMID: 31662747 Free PMC article.
-
MicroRNA, Proteins, and Metabolites as Novel Biomarkers for Prediabetes, Diabetes, and Related Complications.Front Endocrinol (Lausanne). 2018 Apr 23;9:180. doi: 10.3389/fendo.2018.00180. eCollection 2018. Front Endocrinol (Lausanne). 2018. PMID: 29740397 Free PMC article. Review.
References
-
- Andersson, S. A. , Olsson A. H., Esguerra J. L., Heimann E., Ladenvall C., Edlund A., et al. 2012. Reduced insulin secretion correlates with decreased expression of exocytotic genes in pancreatic islets from patients with type 2 diabetes. Mol. Cell. Endocrinol. 364:36–45. - PubMed
-
- Arango Duque, G. , Fukuda M., and Descoteaux A.. 2013. Synaptotagmin XI regulates phagocytosis and cytokine secretion in macrophages. J. Immunol. 190:1737–1745. - PubMed
-
- Barg, S. , Olofsson C. S., Schriever‐Abeln J., Wendt A., Gebre‐Medhin S., Renstrom E., et al. 2002. Delay between fusion pore opening and peptide release from large dense‐core vesicles in neuroendocrine cells. Neuron 33:287–299. - PubMed
MeSH terms
Substances
LinkOut - more resources
Full Text Sources
Other Literature Sources
Medical
Research Materials
Miscellaneous
