

Organ-level validation of a cross-bridge cycling descriptor in a left ventricular finite element model: effects of ventricular loading on myocardial strains
- PMID: 29122952
- PMCID: PMC5688770
- DOI: 10.14814/phy2.13392
Organ-level validation of a cross-bridge cycling descriptor in a left ventricular finite element model: effects of ventricular loading on myocardial strains
Abstract
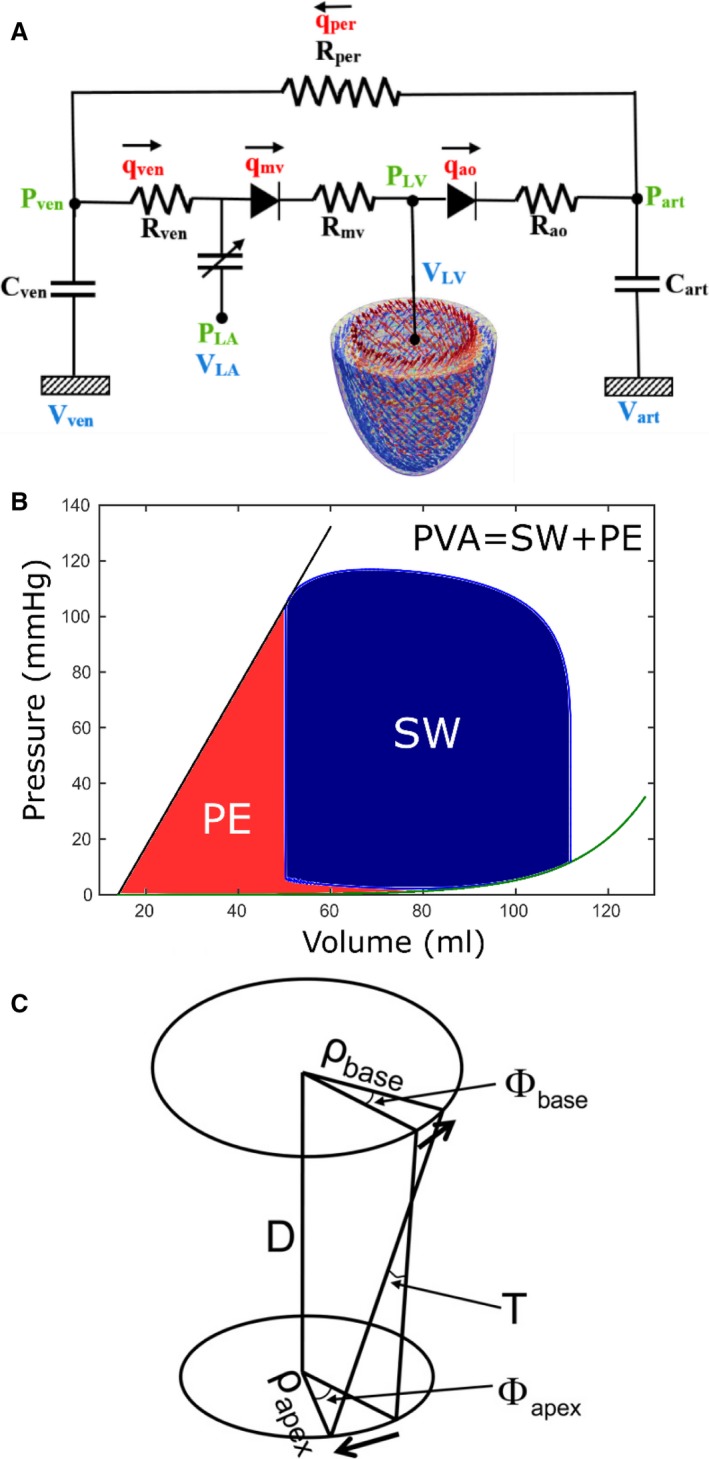
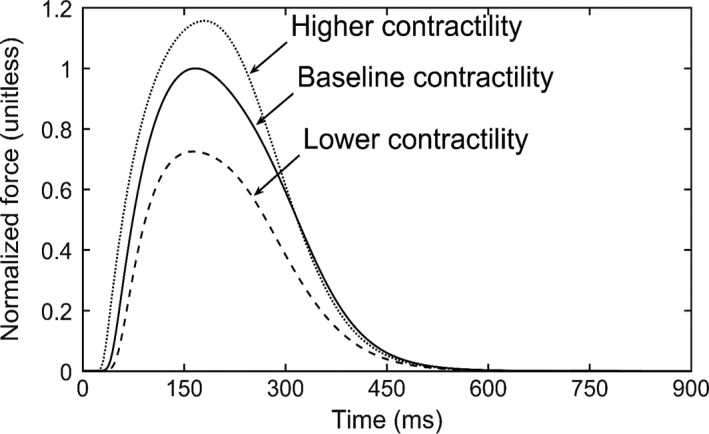
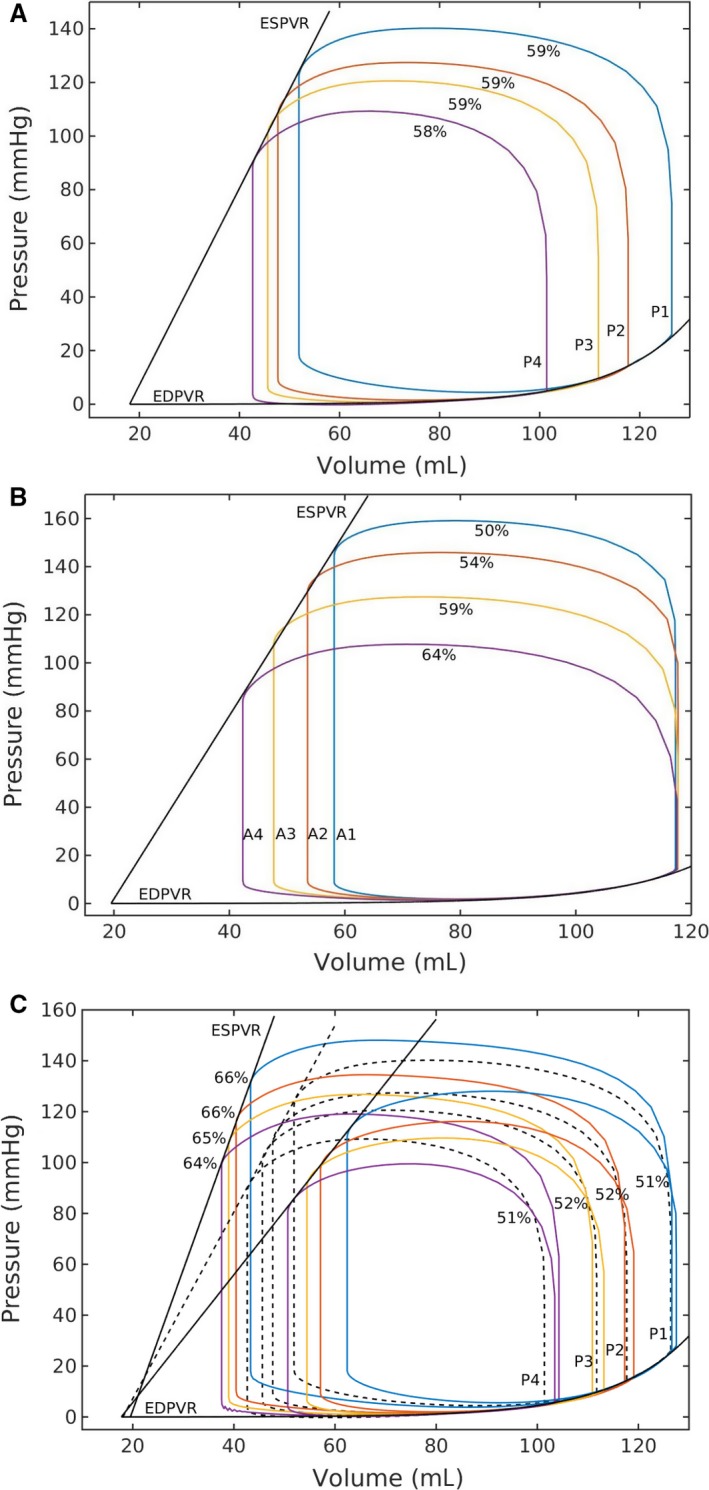
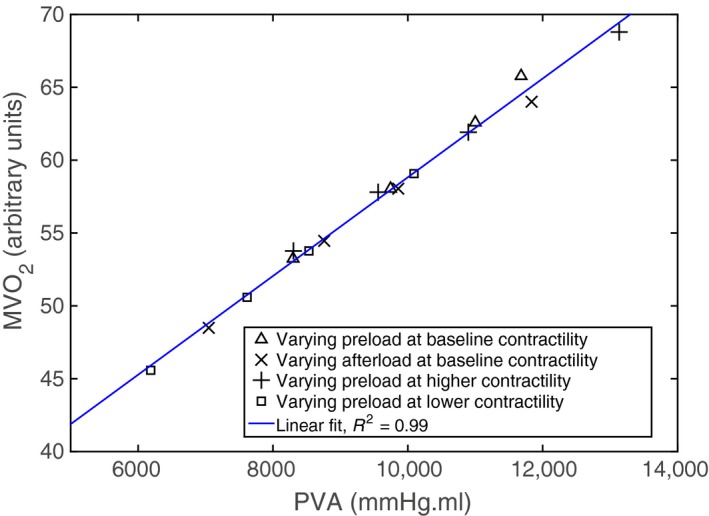
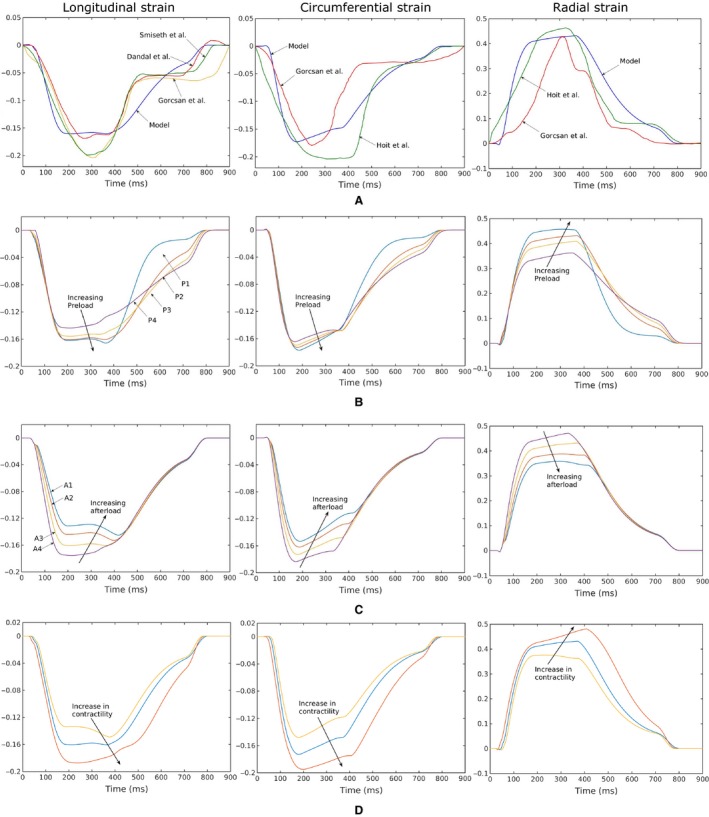
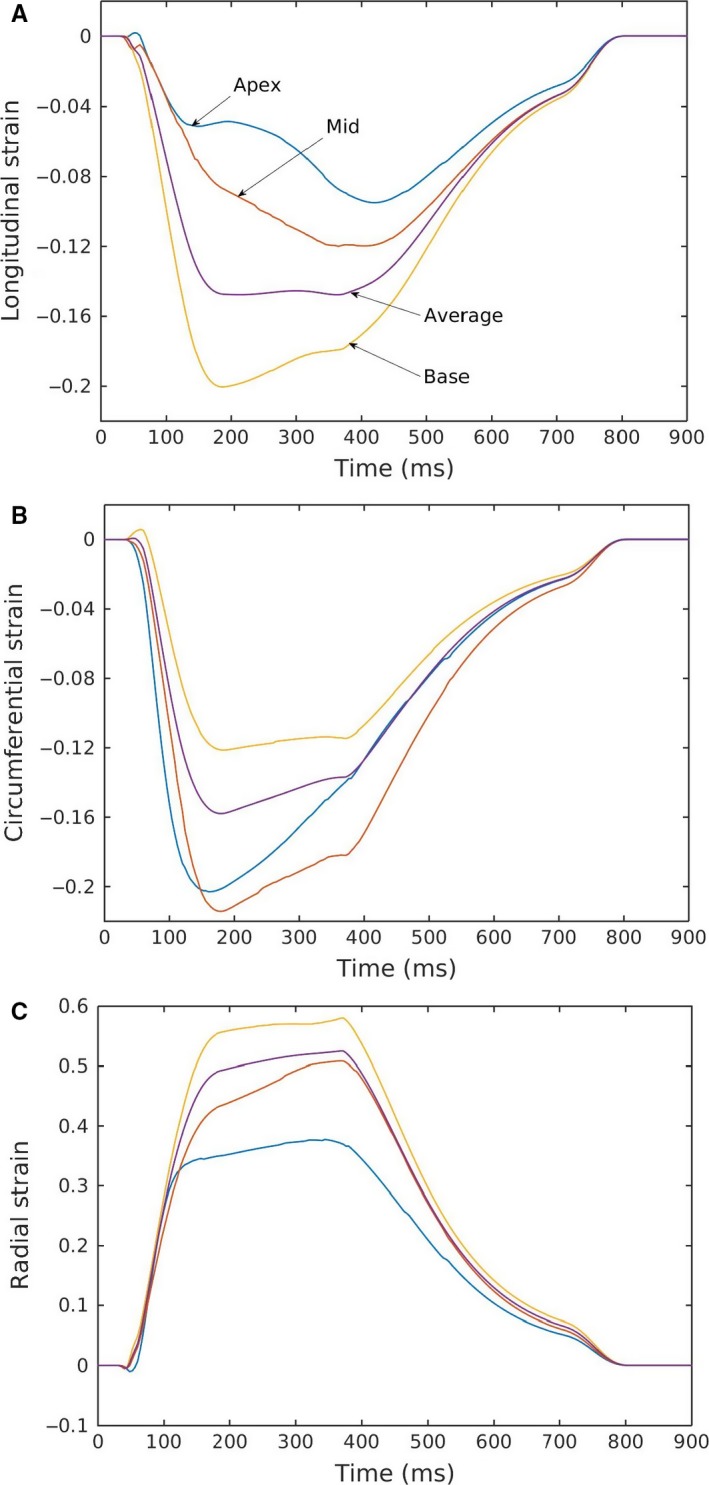
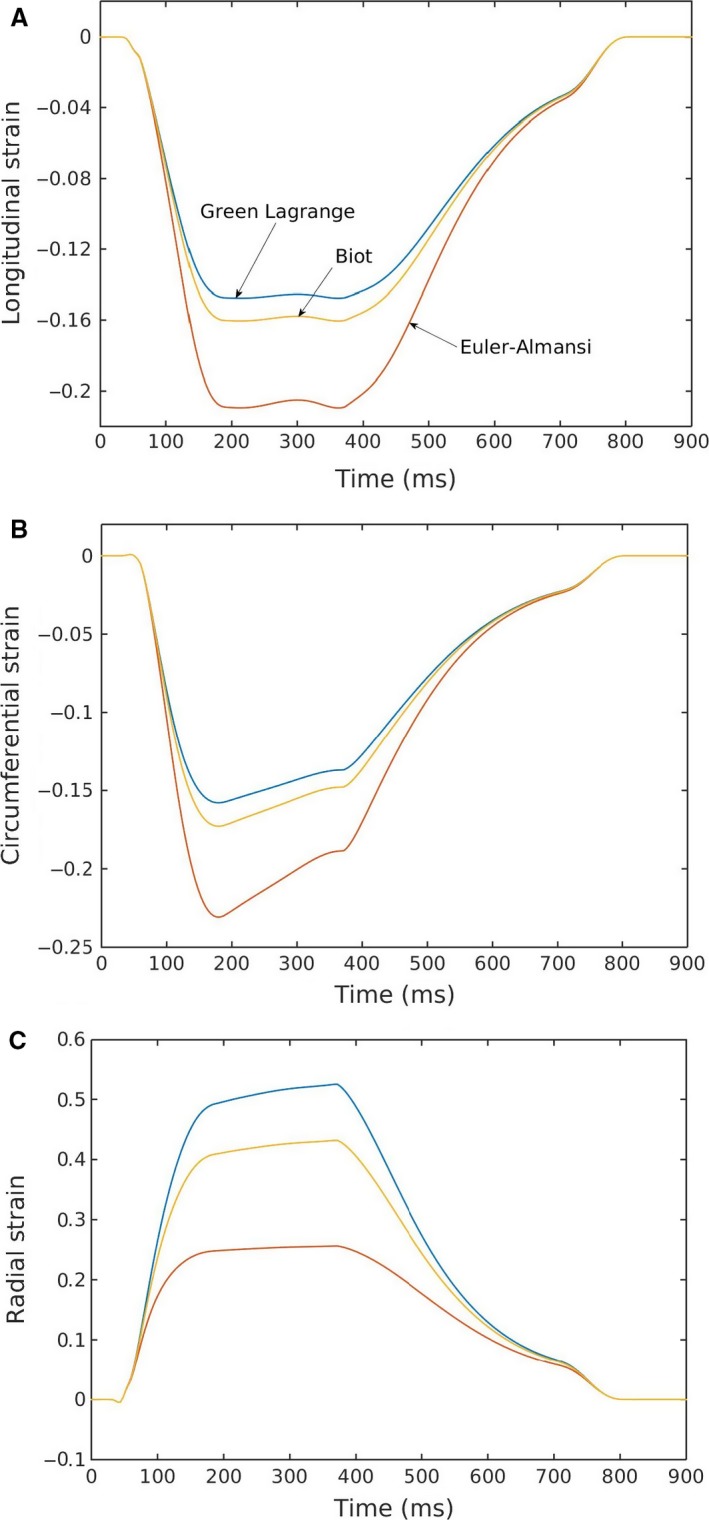
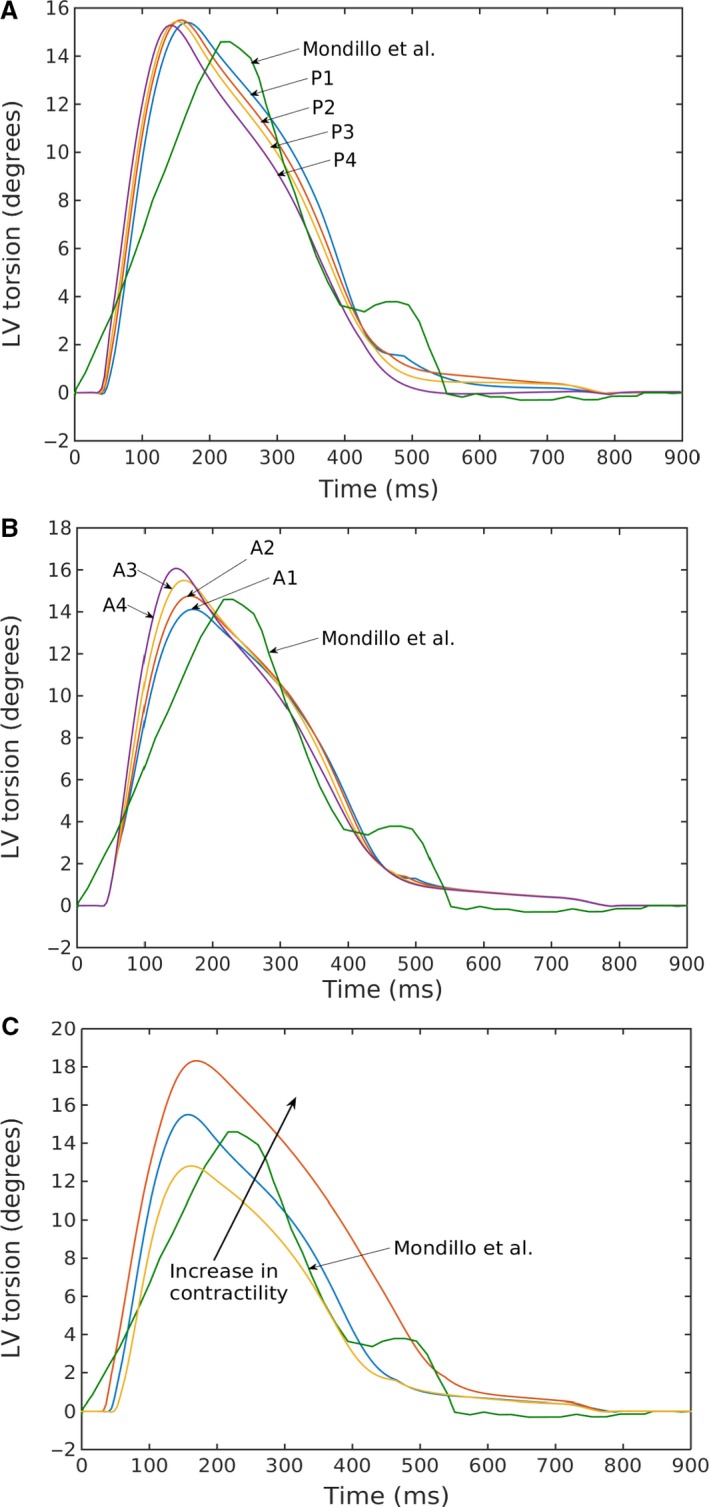
Although detailed cell-based descriptors of cross-bridge cycling have been applied in finite element (FE) heart models to describe ventricular mechanics, these multiscale models have never been tested rigorously to determine if these descriptors, when scaled up to the organ-level, are able to reproduce well-established organ-level physiological behaviors. To address this void, we here validate a left ventricular (LV) FE model that is driven by a cell-based cross-bridge cycling descriptor against key organ-level heart physiology. The LV FE model was coupled to a closed-loop lumped parameter circulatory model to simulate different ventricular loading conditions (preload and afterload) and contractilities. We show that our model is able to reproduce a linear end-systolic pressure volume relationship, a curvilinear end-diastolic pressure volume relationship and a linear relationship between myocardial oxygen consumption and pressure-volume area. We also show that the validated model can predict realistic LV strain-time profiles in the longitudinal, circumferential, and radial directions. The predicted strain-time profiles display key features that are consistent with those measured in humans, such as having similar peak strains, time-to-peak-strain, and a rapid change in strain during atrial contraction at late-diastole. Our model shows that the myocardial strains are sensitive to not only LV contractility, but also to the LV loading conditions, especially to a change in afterload. This result suggests that caution must be exercised when associating changes in myocardial strain with changes in LV contractility. The methodically validated multiscale model will be used in future studies to understand human heart diseases.
Keywords: Cardiac energetics; finite element modeling; left ventricle; myocardial strain.
© 2017 The Authors. Physiological Reports published by Wiley Periodicals, Inc. on behalf of The Physiological Society and the American Physiological Society.
Figures
Similar articles
-
Finite state machine implementation for left ventricle modeling and control.Biomed Eng Online. 2019 Jan 30;18(1):10. doi: 10.1186/s12938-019-0628-3. Biomed Eng Online. 2019. PMID: 30700298 Free PMC article.
-
Insights Into Myocardial Oxygen Consumption, Energetics, and Efficiency Under Left Ventricular Assist Device Support Using Noninvasive Pressure-Volume Loops.Circ Heart Fail. 2019 Oct;12(10):e006191. doi: 10.1161/CIRCHEARTFAILURE.119.006191. Epub 2019 Oct 15. Circ Heart Fail. 2019. PMID: 31610725
-
Coupling between regional myocardial oxygen consumption and contraction under altered preload and afterload.J Am Coll Cardiol. 1993 May;21(6):1522-31. doi: 10.1016/0735-1097(93)90333-v. J Am Coll Cardiol. 1993. PMID: 8473665
-
Nitric oxide's role in the heart: control of beating or breathing?Am J Physiol Heart Circ Physiol. 2004 Jul;287(1):H8-13. doi: 10.1152/ajpheart.01147.2003. Am J Physiol Heart Circ Physiol. 2004. PMID: 15210448 Review.
-
Left ventricular rotation: a neglected aspect of the cardiac cycle.Intensive Care Med. 2011 Jan;37(1):156-63. doi: 10.1007/s00134-010-2053-8. Epub 2010 Sep 29. Intensive Care Med. 2011. PMID: 20878386 Review.
Cited by
-
Transmural Distribution of Coronary Perfusion and Myocardial Work Density Due to Alterations in Ventricular Loading, Geometry and Contractility.Front Physiol. 2021 Nov 24;12:744855. doi: 10.3389/fphys.2021.744855. eCollection 2021. Front Physiol. 2021. PMID: 34899378 Free PMC article.
-
A Multiple Step Active Stiffness Integration Scheme to Couple a Stochastic Cross-Bridge Model and Continuum Mechanics for Uses in Both Basic Research and Clinical Applications of Heart Simulation.Front Physiol. 2021 Aug 13;12:712816. doi: 10.3389/fphys.2021.712816. eCollection 2021. Front Physiol. 2021. PMID: 34483965 Free PMC article.
-
Computational analysis of ventricular mechanics in hypertrophic cardiomyopathy patients.Sci Rep. 2023 Jan 18;13(1):958. doi: 10.1038/s41598-023-28037-w. Sci Rep. 2023. PMID: 36653468 Free PMC article.
-
In-silico assessment of the effects of right ventricular assist device on pulmonary arterial hypertension using an image based biventricular modeling framework.Mech Res Commun. 2019 Apr;97:101-111. doi: 10.1016/j.mechrescom.2019.04.008. Epub 2019 Apr 15. Mech Res Commun. 2019. PMID: 31983787 Free PMC article.
-
Biomechanics of Human Fetal Hearts with Critical Aortic Stenosis.Ann Biomed Eng. 2021 May;49(5):1364-1379. doi: 10.1007/s10439-020-02683-x. Epub 2020 Nov 11. Ann Biomed Eng. 2021. PMID: 33175989 Free PMC article.
References
-
- Adeniran, I. , Hancox J. C., and Zhang H.. 2013b. Effect of cardiac ventricular mechanical contraction on the characteristics of the ECG: a simulation study. J Biomed Sci Eng 6:47–60.
-
- Adeniran, I. , MacIver D. H., Hancox J. C., and Zhang H.. 2015. Abnormal calcium homeostasis in heart failure with preserved ejection fraction is related to both reduced contractile function and incomplete relaxation: an electromechanically detailed biophysical modeling study. Front. Physiol. 6:78. - PMC - PubMed
-
- Burkhoff, D. 1994. Explaining load dependence of ventricular contractile properties with a model of excitation‐contraction coupling. J. Mol. Cell. Cardiol. 26:959–978. - PubMed
-
- Burkhoff, D. , de Tombe P. P., Hunter W. C., and Kass D. A.. 1991. Contractile strength a of left ventricle are enhanced anical efficiency by physiological afterload. Am J Hear Circ Physilogy 260:569–578. - PubMed
MeSH terms
LinkOut - more resources
Full Text Sources
Other Literature Sources
