Gut microbiome modulates response to anti-PD-1 immunotherapy in melanoma patients
- PMID: 29097493
- PMCID: PMC5827966
- DOI: 10.1126/science.aan4236
Gut microbiome modulates response to anti-PD-1 immunotherapy in melanoma patients
Abstract
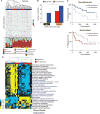
Preclinical mouse models suggest that the gut microbiome modulates tumor response to checkpoint blockade immunotherapy; however, this has not been well-characterized in human cancer patients. Here we examined the oral and gut microbiome of melanoma patients undergoing anti-programmed cell death 1 protein (PD-1) immunotherapy (n = 112). Significant differences were observed in the diversity and composition of the patient gut microbiome of responders versus nonresponders. Analysis of patient fecal microbiome samples (n = 43, 30 responders, 13 nonresponders) showed significantly higher alpha diversity (P < 0.01) and relative abundance of bacteria of the Ruminococcaceae family (P < 0.01) in responding patients. Metagenomic studies revealed functional differences in gut bacteria in responders, including enrichment of anabolic pathways. Immune profiling suggested enhanced systemic and antitumor immunity in responding patients with a favorable gut microbiome as well as in germ-free mice receiving fecal transplants from responding patients. Together, these data have important implications for the treatment of melanoma patients with immune checkpoint inhibitors.
Copyright © 2018, American Association for the Advancement of Science.
Figures


Comment in
-
Immunotherapy: Gut bacteria modulate responses to PD-1 blockade.Nat Rev Clin Oncol. 2018 Jan;15(1):6-7. doi: 10.1038/nrclinonc.2017.182. Epub 2017 Nov 21. Nat Rev Clin Oncol. 2018. PMID: 29158588 No abstract available.
-
Precision medicine using microbiota.Science. 2018 Jan 5;359(6371):32-34. doi: 10.1126/science.aar2946. Science. 2018. PMID: 29302001 No abstract available.
-
Anti-PD1 in the wonder-gut-land.Cell Res. 2018 Mar;28(3):263-264. doi: 10.1038/cr.2018.12. Epub 2018 Jan 16. Cell Res. 2018. PMID: 29336431 Free PMC article.
-
Microbiome: Gut microbiota sways response to cancer immunotherapy.Nat Rev Microbiol. 2018 Mar;16(3):121. doi: 10.1038/nrmicro.2018.12. Epub 2018 Jan 22. Nat Rev Microbiol. 2018. PMID: 29355853 No abstract available.
-
Checkpoint Checkmate: Microbiota Modulation of Cancer Immunotherapy.Clin Chem. 2018 Sep;64(9):1280-1283. doi: 10.1373/clinchem.2017.286229. Epub 2018 Apr 24. Clin Chem. 2018. PMID: 29691222 Free PMC article. No abstract available.
-
The microbiome influence.Nat Med. 2018 Dec;24(12):1782. doi: 10.1038/s41591-018-0285-2. Nat Med. 2018. PMID: 30523317 No abstract available.
-
[Gut microbiome influences efficacy of immunotherapy].Bull Cancer. 2019 Jan;106(1):10. doi: 10.1016/j.bulcan.2018.12.004. Epub 2019 Jan 11. Bull Cancer. 2019. PMID: 30642560 French. No abstract available.
Similar articles
-
The commensal microbiome is associated with anti-PD-1 efficacy in metastatic melanoma patients.Science. 2018 Jan 5;359(6371):104-108. doi: 10.1126/science.aao3290. Science. 2018. PMID: 29302014 Free PMC article.
-
Fecal microbiota transplant promotes response in immunotherapy-refractory melanoma patients.Science. 2021 Feb 5;371(6529):602-609. doi: 10.1126/science.abb5920. Epub 2020 Dec 10. Science. 2021. PMID: 33303685 Clinical Trial.
-
The Diversity of Gut Microbiome is Associated With Favorable Responses to Anti-Programmed Death 1 Immunotherapy in Chinese Patients With NSCLC.J Thorac Oncol. 2019 Aug;14(8):1378-1389. doi: 10.1016/j.jtho.2019.04.007. Epub 2019 Apr 23. J Thorac Oncol. 2019. PMID: 31026576
-
A viable remedy for overcoming resistance to anti-PD-1 immunotherapy: Fecal microbiota transplantation.Crit Rev Oncol Hematol. 2024 Aug;200:104403. doi: 10.1016/j.critrevonc.2024.104403. Epub 2024 Jun 3. Crit Rev Oncol Hematol. 2024. PMID: 38838927 Review.
-
Gut microbiome modulates efficacy of immune checkpoint inhibitors.J Hematol Oncol. 2018 Mar 27;11(1):47. doi: 10.1186/s13045-018-0592-6. J Hematol Oncol. 2018. PMID: 29580257 Free PMC article. Review.
Cited by
-
Chemotherapy combined with immune checkpoint inhibitors may overcome the detrimental effect of high neutrophil-to-lymphocyte ratio prior to treatment in esophageal cancer patients.Front Oncol. 2024 Oct 11;14:1449941. doi: 10.3389/fonc.2024.1449941. eCollection 2024. Front Oncol. 2024. PMID: 39464714 Free PMC article.
-
Perspectives in immunotherapy: meeting report from the immunotherapy bridge (December 2nd-3rd, 2020, Italy).J Transl Med. 2021 Jun 2;19(1):238. doi: 10.1186/s12967-021-02895-2. J Transl Med. 2021. PMID: 34078406 Free PMC article.
-
The gut microbiota in patients with polycythemia vera is distinct from that of healthy controls and varies by treatment.Blood Adv. 2023 Jul 11;7(13):3326-3337. doi: 10.1182/bloodadvances.2022008555. Blood Adv. 2023. PMID: 36260736 Free PMC article.
-
Targeting gut microbiota for precision medicine: Focusing on the efficacy and toxicity of drugs.Theranostics. 2020 Sep 14;10(24):11278-11301. doi: 10.7150/thno.47289. eCollection 2020. Theranostics. 2020. PMID: 33042283 Free PMC article. Review.
-
Obesity-related gut hormones and cancer: novel insight into the pathophysiology.Int J Obes (Lond). 2021 Sep;45(9):1886-1898. doi: 10.1038/s41366-021-00865-8. Epub 2021 Jun 4. Int J Obes (Lond). 2021. PMID: 34088971
References
-
- Schadendorf D, Hodi FS, Robert C, Weber JS, Margolin K, Hamid O, Patt D, Chen T-T, Berman DM, Wolchok JD. Pooled analysis of long-term survival data from phase II and phase III trials of ipilimumab in unresectable or metastatic melanoma. J. Clin. Oncol. 2015;33:1889–1894. doi: 10.1200/JCO.2014.56.2736. - DOI - PMC - PubMed
-
- Robert C, Long GV, Brady B, Dutriaux C, Maio M, Mortier L, Hassel JC, Rutkowski P, McNeil C, Kalinka-Warzocha E, Savage KJ, Hernberg MM, Lebbé C, Charles J, Mihalcioiu C, Chiarion-Sileni V, Mauch C, Cognetti F, Arance A, Schmidt H, Schadendorf D, Gogas H, Lundgren-Eriksson L, Horak C, Sharkey B, Waxman IM, Atkinson V, Ascierto PA. Nivolumab in previously untreated melanoma without BRAF mutation. N. Engl. J. Med. 2015;372:320–330. doi: 10.1056/NEJMoa1412082. - DOI - PubMed
Publication types
MeSH terms
Substances
Grants and funding
LinkOut - more resources
Full Text Sources
Other Literature Sources
Medical

