

A distinct hematopoietic stem cell population for rapid multilineage engraftment in nonhuman primates
- PMID: 29093179
- PMCID: PMC6467214
- DOI: 10.1126/scitranslmed.aan1145
A distinct hematopoietic stem cell population for rapid multilineage engraftment in nonhuman primates
Abstract
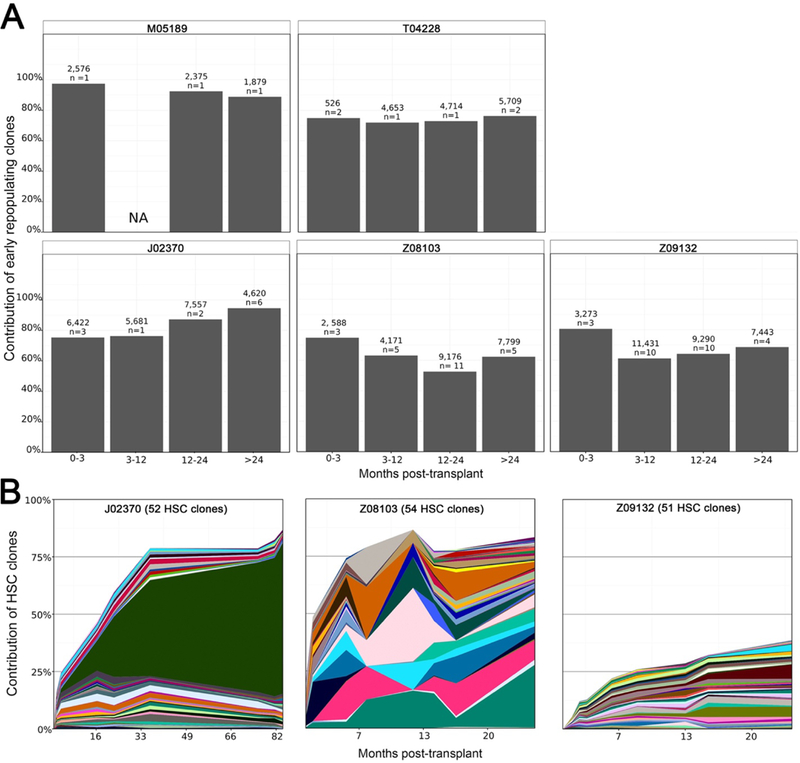
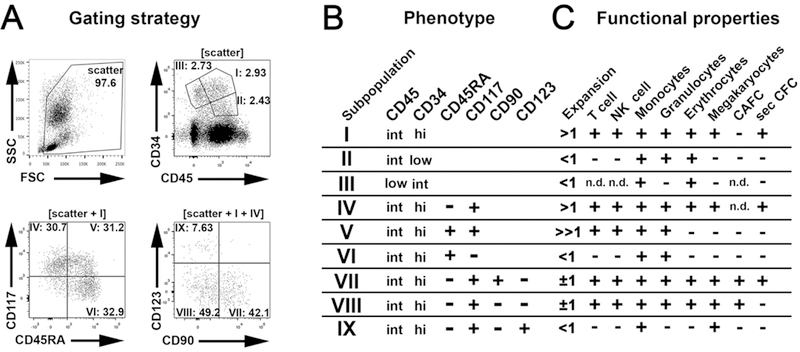
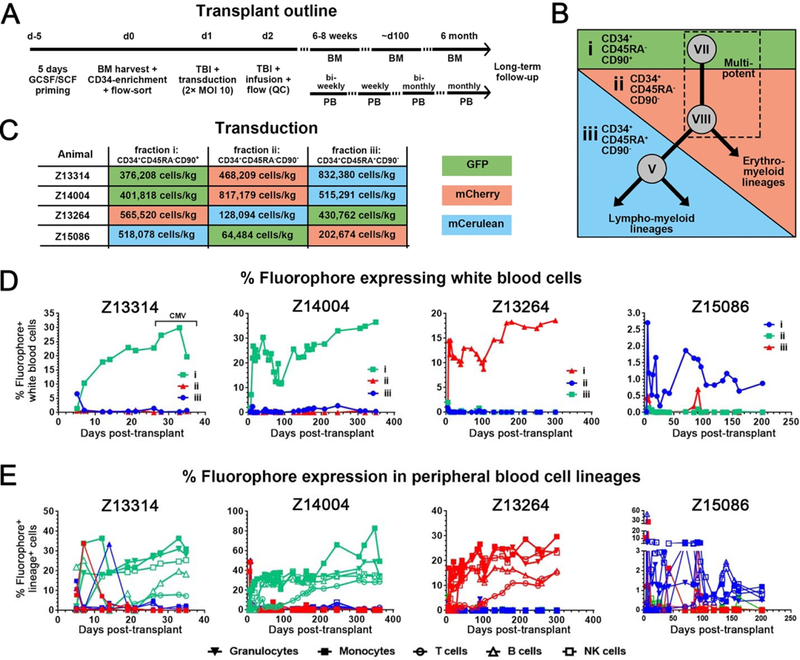
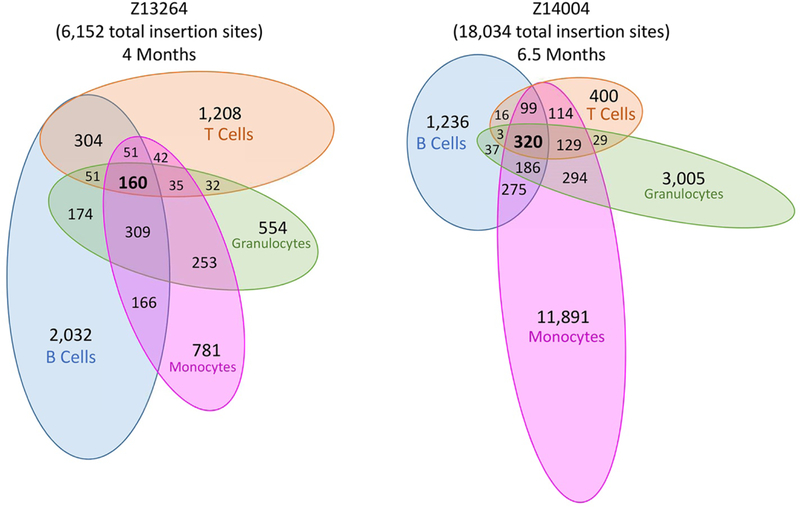
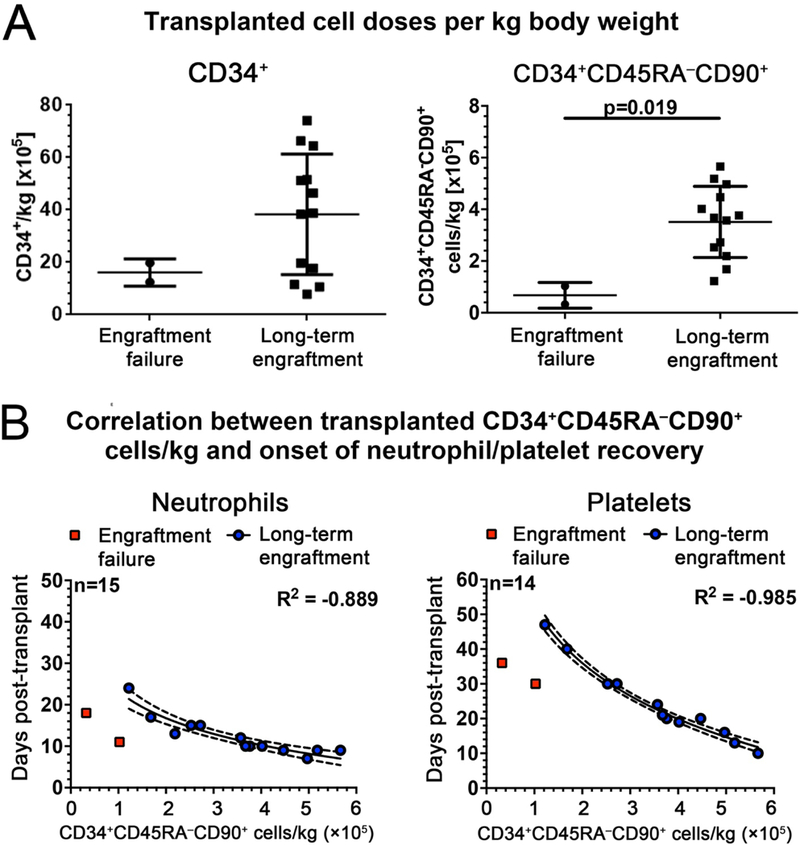
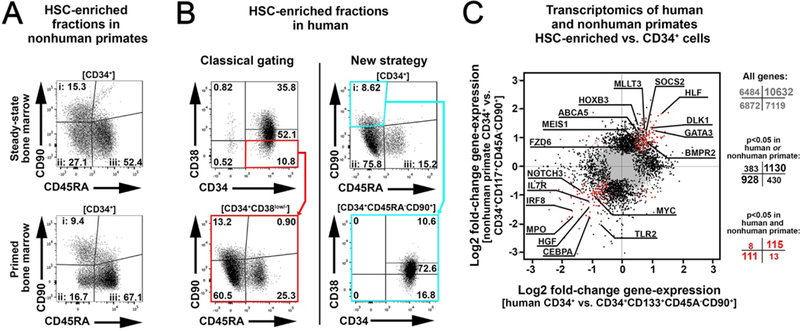
Hematopoietic reconstitution after bone marrow transplantation is thought to be driven by committed multipotent progenitor cells followed by long-term engrafting hematopoietic stem cells (HSCs). We observed a population of early-engrafting cells displaying HSC-like behavior, which persisted long-term in vivo in an autologous myeloablative transplant model in nonhuman primates. To identify this population, we characterized the phenotype and function of defined nonhuman primate hematopoietic stem and progenitor cell (HSPC) subsets and compared these to human HSPCs. We demonstrated that the CD34+CD45RA-CD90+ cell phenotype is highly enriched for HSCs. This population fully supported rapid short-term recovery and robust multilineage hematopoiesis in the nonhuman primate transplant model and quantitatively predicted transplant success and time to neutrophil and platelet recovery. Application of this cell population has potential in the setting of HSC transplantation and gene therapy/editing approaches.
Copyright © 2017 The Authors, some rights reserved; exclusive licensee American Association for the Advancement of Science. No claim to original U.S. Government Works.
Figures
Similar articles
-
Endothelial Cells Promote Expansion of Long-Term Engrafting Marrow Hematopoietic Stem and Progenitor Cells in Primates.Stem Cells Transl Med. 2017 Mar;6(3):864-876. doi: 10.5966/sctm.2016-0240. Epub 2016 Oct 14. Stem Cells Transl Med. 2017. PMID: 28297579 Free PMC article.
-
Long-term multilineage engraftment of autologous genome-edited hematopoietic stem cells in nonhuman primates.Blood. 2016 May 19;127(20):2416-26. doi: 10.1182/blood-2015-09-672337. Epub 2016 Mar 15. Blood. 2016. PMID: 26980728 Free PMC article.
-
Engraftment and lineage potential of adult hematopoietic stem and progenitor cells is compromised following short-term culture in the presence of an aryl hydrocarbon receptor antagonist.Hum Gene Ther Methods. 2014 Aug;25(4):221-31. doi: 10.1089/hgtb.2014.043. Hum Gene Ther Methods. 2014. PMID: 25003230 Free PMC article.
-
CD34+ CD90+ cells and late hematopoietic reconstitution after autologous peripheral blood stem cell transplantation.Leuk Lymphoma. 2004 Apr;45(4):661-8. doi: 10.1080/1042819031000140997. Leuk Lymphoma. 2004. PMID: 15160937 Review.
-
The role of granulocyte colony-stimulating factor in mobilization and transplantation of peripheral blood progenitor and stem cells.Cytokines Mol Ther. 1995 Dec;1(4):249-70. Cytokines Mol Ther. 1995. PMID: 9384679 Review.
Cited by
-
Genetic engineering of hematopoiesis: current stage of clinical translation and future perspectives.EMBO Mol Med. 2019 Mar;11(3):e9958. doi: 10.15252/emmm.201809958. EMBO Mol Med. 2019. PMID: 30670463 Free PMC article. Review.
-
Stem Cell-Based Disease Models for Inborn Errors of Immunity.Cells. 2021 Dec 30;11(1):108. doi: 10.3390/cells11010108. Cells. 2021. PMID: 35011669 Free PMC article. Review.
-
Targeted, safe, and efficient gene delivery to human hematopoietic stem and progenitor cells in vivo using the engineered AVID adenovirus vector platform.Mol Ther. 2024 Jan 3;32(1):103-123. doi: 10.1016/j.ymthe.2023.10.023. Epub 2023 Nov 2. Mol Ther. 2024. PMID: 37919899 Free PMC article.
-
Advances in preclinical hematopoietic stem cell models and possible implications for improving therapeutic transplantation.Stem Cells Transl Med. 2021 Mar;10(3):337-345. doi: 10.1002/sctm.20-0294. Epub 2020 Oct 15. Stem Cells Transl Med. 2021. PMID: 33058566 Free PMC article. Review.
-
Manipulation of Developmental Gamma-Globin Gene Expression: an Approach for Healing Hemoglobinopathies.Mol Cell Biol. 2020 Dec 21;41(1):e00253-20. doi: 10.1128/MCB.00253-20. Print 2020 Dec 21. Mol Cell Biol. 2020. PMID: 33077498 Free PMC article. Review.
References
-
- Bystrykh LV, Verovskaya E, Zwart E, Broekhuis M, de Haan G, Counting stem cells: methodological constraints. Nat Methods 9, 567–574 (2012). - PubMed
-
- Brady G, Billia F, Knox J, Hoang T, Kirsch IR, Voura EB, Hawley RG, Cumming R, Buchwald M, Siminovitch K, Analysis of gene expression in a complex differentiation hierarchy by global amplification of cDNA from single cells. Current biology : CB 5, 909–922 (1995). - PubMed
-
- Jordan CT, Lemischka IR, Clonal and systemic analysis of long-term hematopoiesis in the mouse. Genes & Development 4, 220–232 (1990). - PubMed
-
- Drize N, Chertkov J, Sadovnikova E, Tiessen S, Zander A, Long-term maintenance of hematopoiesis in irradiated mice by retrovirally transduced peripheral blood stem cells. Blood 89, 1811–1817 (1997). - PubMed
MeSH terms
Substances
Grants and funding
LinkOut - more resources
Full Text Sources
Other Literature Sources
Medical
