. 2017 Nov 14;114(46):E10018-E10027.
doi: 10.1073/pnas.1708433114. Epub 2017 Oct 30.

Global analysis of ribosome-associated noncoding RNAs unveils new modes of translational regulation

Affiliations

Global analysis of ribosome-associated noncoding RNAs unveils new modes of translational regulation

Jérémie Bazin et al. Proc Natl Acad Sci U S A. .

Abstract

Eukaryotic transcriptomes contain a major non-protein-coding component that includes precursors of small RNAs as well as long noncoding RNA (lncRNAs). Here, we utilized the mapping of ribosome footprints on RNAs to explore translational regulation of coding and noncoding RNAs in roots of Arabidopsis thaliana shifted from replete to deficient phosphorous (Pi) nutrition. Homodirectional changes in steady-state mRNA abundance and translation were observed for all but 265 annotated protein-coding genes. Of the translationally regulated mRNAs, 30% had one or more upstream ORF (uORF) that influenced the number of ribosomes on the principal protein-coding region. Nearly one-half of the 2,382 lncRNAs detected had ribosome footprints, including 56 with significantly altered translation under Pi-limited nutrition. The prediction of translated small ORFs (sORFs) by quantitation of translation termination and peptidic analysis identified lncRNAs that produce peptides, including several deeply evolutionarily conserved and significantly Pi-regulated lncRNAs. Furthermore, we discovered that natural antisense transcripts (NATs) frequently have actively translated sORFs, including five with low-Pi up-regulation that correlated with enhanced translation of the sense protein-coding mRNA. The data also confirmed translation of miRNA target mimics and lncRNAs that produce trans-acting or phased small-interfering RNA (tasiRNA/phasiRNAs). Mutational analyses of the positionally conserved sORF of TAS3a linked its translation with tasiRNA biogenesis. Altogether, this systematic analysis of ribosome-associated mRNAs and lncRNAs demonstrates that nutrient availability and translational regulation controls protein and small peptide-encoding mRNAs as well as a diverse cadre of regulatory RNAs.

Keywords: Arabidopsis thaliana; long noncoding RNA; phosphate deficiency; ribosome footprint profiling; small peptides.


Conflict of interest statement

The authors declare no conflict of interest.

Figures

Fig. 1.
Fig. 1.
Transcriptome mRNA-seq and ribo-seq expose selective translational regulation in response to phosphate starvation. (A) Pi starvation promotes lateral root development. (B) Coverage values [reads per million reads (rpM)] of the first nucleotide of 28-nt ribosome footprints (RFs) in the start and stop codon regions of expressed protein-coding genes at the same scale. Inferred ribosome position relative to the acyl (A), peptidyl (P), and exit (E) sites of the ribosome with the AUG in the P and stop codon in the A site. (C) Comparison of RNA-seq [total poly(A)+ mRNA] and ribo-seq (RFs) log2 FC in response to Pi deficiency (+Pi roots relative to −Pi roots). (D) Translational efficiency (TE) relative to RNA-seq log2 fold change in response to Pi deficiency. Based on mRNAs with ≥5 RF reads per kilobase million reads in all replicates. Genes regulated at RNA and/or RF and TE levels (FDR < 0.01) are indicated with colored dots. Coefficient of determination is indicated in C. (E) Gene view of coverage of mRNA and RF reads on selected genes: CYTOKININ RESPONSE FACTOR 10 (CRF10) (AT1G68550), AUXIN RESPONSE FACTOR 4 (ARF4) (AT5G60450), and PHOSPHATE 2 (PHO2) (AT2G33770). Scales are identical for each data type per gene. Gene structure is diagrammed at the Bottom: red boxes mark upstream ORFs in the 5′ leader of protein-coding genes; light blue boxes represent the main ORF; and dark blue and green lines in the PHO2 5′-UTR represent noncleavable and cleavable miR399 binding sites, respectively. Black arrows indicate direction of transcription.
Fig. 2.
Fig. 2.
Nearly one-half of all detected lncRNAs are associated with ribosomes. (A) Discovery pipeline for ribosome-associated lncRNAs (ribo-lncRNAs) and their classification. lncRNAs were predicted de novo from compiled mRNA-seq data (Pi-replete and -deficient roots) (Cufflinks) and merged with annotated lncRNAs (Araport11). Classification as a ribo-lncRNA required ribosome footprint (RF) read coverage above background (HTSFilter). Small RNA (sRNA)-seq data from Pi-replete roots were used to identify sRNA and phasiRNA precursors (88). sORF translation was recognized using two analytics: ribosome release score (RRS) (15) and RiboTaper (50), and supported by evolutionary conservation of sORFs and proteomic mass spectra data of encoded small peptides. (B) Summary of classified lncRNAs. Canonical lncRNAs are all those not classified as a ribo-lncRNA. Numbers in red indicate the number of differentially expressed lncRNAs (FDR < 0.01) in each subclass. (C) Normalized read coverage of mRNA-seq, ribo-seq, and 21- to 22-nt-long sRNA-seq reads on representatives of subclasses. Nuclear lncRNA ASCO (AT1G67105); miRNA target mimic INDUCED BY PHOSPHATE STARVATION 1 (IPS1) (AT3G09922); putative small peptide-coding gene AT1G20724; ribo-cis-NAT generating 21- to 22-nt siRNAs [SUPPRESSOR OF PHYB 3 (SOB3) cis-NAT AT1G76500]; precursor of 21-nt phased sRNA (phasiRNA) AT1G62860; and TRANS-ACTING SIRNA 3a (TAS3a) (AT3G17185). Scales are identical for each data type per gene. Gene structure is diagrammed at the Bottom: light blue boxes represent coding regions including ORFs with ribosome footprints; red box on IPS1 is a miR399 binding site. Black arrows indicate direction of transcription of sense (protein-coding) ORFs and NATs.
Fig. 3.
Fig. 3.
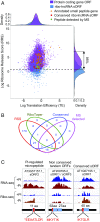
Translated sORF are hidden in lncRNAs. (A) Translation efficiency (TE) and ribosome release score (RSS) for protein-coding genes and ribosome-associated lncRNAs with small ORFs (ribo-lncRNA_sORFs). Annotated small peptide-coding genes, conserved ribo-lncRNA sORFs and mass spectra validated sORFs are indicated as orange, red, and green dots, respectively. The vertical arrow on the RSS density plot (Right) marks the region between the upper and lower 5% quantiles of RRS distribution of protein-coding genes. Ribo-lncRNA sORFs with an RSS within this range are the putative translated lncRNA_sORFs. (B) Venn diagram of ribo-lncRNA sORFs predicted using RRS or RiboTaper, having significant conservation across plants and evidence of peptide production by mass spectrometry. (C) Example sORFs with peptidic support. Normalized transcript coverage plots of mRNA-seq and ribo-seq reads from Pi replete and deficient roots. An 11-aa micropeptide (AT3G57157). Tandem sORFs of 63 and 27 aa (AT2G20724). A translated conserved sORF (AT1G67195). Scales are identical for each data type per gene. Gene structure is diagramed as in Fig. 1, with amino acid length of predicted ORF. Red box indicates peptide region detected in proteomic spectra; asterisk, amino acid acetylation.
Fig. 4.
Fig. 4.
Regulation of a subset of ribo-cis-NATs correlates with translation of their cognate sense mRNAs. (A) Log2 FC of ribo-cis-NAT (cisNAT dsRNA-seq), mRNA RF (mRNA Ribo), poly(A)+ cis-NAT, and poly(A)+ mRNA values for the five translationally regulated NAT/sense mRNA pairs (**FDR < 0.05; ***FDR < 0.01). (B) Normalized read coverage of RNA-seq, ribo-seq, dsRNA-seq, and 21- to 22-nt sRNA-seq reads of representative sense–antisense pairs displaying low Pi regulation. ATP-BINDING CASSETTE SUB-FAMILY G transporter (ABCG2) (AT2G37360), ABCG20 (AT3G53510), and POLLEN-SPECIFIC RECEPTOR-LIKE KINASE 7 (PRK7) (AT4G31250). Blue and red boxes, coding regions based on annotation (protein-coding gene) or RFs (cis-NAT), respectively; thin black lines, introns; thick black boxes, noncoding regions. Arrows mark direction of transcription.
Fig. 5.
Fig. 5.
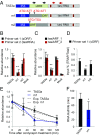
Translation of the TAS3a sORF promotes tasiRNA production. (A) Constructs used to evaluate the coupling of TAS3a translation and tasiRNA production. Green boxes show sORF region, and black triangles show targeted mutations. Brown boxes show miR390 binding sites. Black arrows represent the position of primers used for quantification of transcripts with the sORF region (black arrows, primer set 1) and tasiRNA-generating region (red arrows, primer set 2). TAS3a precursor transcript detection by RT-qPCR (B) and tasiARF_1 and tasiARF_2 by RT-Stem Loop-qPCR (C), 48 h after transfection of N. benthamiana leaves with Agrobacterium-containing TAS3a constructs. Relative abundance (mean ± SD) with Ct values normalized against the BAR gene expressed from the same T-DNA. (D) Quantification of ribosome association of TAS3a, TAS3a-m1, and TAS3a-m2 transcripts in Nicotiana benthamiana (35S:FLAG-AtRPL18) leaves 48 h after Agrobacterium infiltration using TRAP. Results are shown as percentage of input (total RNA) and represent the mean ± SD of three independent replicates. Student’s t test, *P < 0.05; **P < 0.01. (E) RNA decay time course of TAS3a precursor (primer set 1) abundance in N. benthamiana leaves infiltrated with constructs and treated with cordycepin 24 h after transfection. Relative abundance values were calculated as for C. Solid lines, data points; dashed line, exponential regression (Exp.) used to calculate RNA half-life. (F) RNA half-life derived from exponential regression (mean ± SD). Student’s t test, *P < 0.05.

Similar articles

Cited by

References

    1. Djebali S, et al. Landscape of transcription in human cells. Nature. 2012;489:101–108. - PMC - PubMed
    1. Ariel F, Romero-Barrios N, Jégu T, Benhamed M, Crespi M. Battles and hijacks: Noncoding transcription in plants. Trends Plant Sci. 2015;20:362–371. - PubMed
    1. Rogers K, Chen X. Biogenesis, turnover, and mode of action of plant microRNAs. Plant Cell. 2013;25:2383–2399. - PMC - PubMed
    1. Bazin J, Bailey-Serres J. Emerging roles of long non-coding RNA in root developmental plasticity and regulation of phosphate homeostasis. Front Plant Sci. 2015;6:400. - PMC - PubMed
    1. Cech TR, Steitz JA. The noncoding RNA revolution-trashing old rules to forge new ones. Cell. 2014;157:77–94. - PubMed

Publication types