. 2017 Oct 30;7(1):14327.
doi: 10.1038/s41598-017-14523-5.

An Effective Model of the Retinoic Acid Induced HL-60 Differentiation Program

Affiliations

An Effective Model of the Retinoic Acid Induced HL-60 Differentiation Program

Ryan Tasseff et al. Sci Rep. .

Abstract

In this study, we present an effective model All-Trans Retinoic Acid (ATRA)-induced differentiation of HL-60 cells. The model describes reinforcing feedback between an ATRA-inducible signalsome complex involving many proteins including Vav1, a guanine nucleotide exchange factor, and the activation of the mitogen activated protein kinase (MAPK) cascade. We decomposed the effective model into three modules; a signal initiation module that sensed and transformed an ATRA signal into program activation signals; a signal integration module that controlled the expression of upstream transcription factors; and a phenotype module which encoded the expression of functional differentiation markers from the ATRA-inducible transcription factors. We identified an ensemble of effective model parameters using measurements taken from ATRA-induced HL-60 cells. Using these parameters, model analysis predicted that MAPK activation was bistable as a function of ATRA exposure. Conformational experiments supported ATRA-induced bistability. Additionally, the model captured intermediate and phenotypic gene expression data. Knockout analysis suggested Gfi-1 and PPARg were critical to the ATRAinduced differentiation program. These findings, combined with other literature evidence, suggested that reinforcing feedback is central to hyperactive signaling in a diversity of cell fate programs.


Conflict of interest statement

The authors declare that they have no competing interests.

Figures

Figure 1
Figure 1
Schematic of the effective ATRA differentiation circuit. Above a critical threshold, ATRA activates an upstream Trigger, which induces signalsome complex formation. Signalsome activates the mitogen-activated protein kinase (MAPK) cascade which in turn drives the differentiation program and signalsome formation. Both Trigger and activated cRaf-pS621 drive a phenotype gene expression program responsible for differentiation. Trigger activates the expression of a series of transcription factors which in combination with cRaf-pS621 result in phenotypic change.
Figure 2
Figure 2
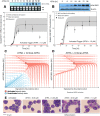
Model analysis for ATRA-induced HL-60 differentiation. (A) BLR1 mRNA versus time following exposure to 1 μM ATRA at t = 0 hr. (B) cRaf-pS621 versus time following exposure to 1 μM ATRA at t = 0 hr. Points denote experimental measurements, solid lines denote the mean model performance. Shaded regions denote the 99% confidence interval calculated over the parameter ensemble. (C) Signalsome and cRaf-pS621 nullclines for ATRA below the critical threshold. The model had two stable steady states and a single unstable state in this regime. (D) Signalsome and cRaf-pS621 nullclines for ATRA above the critical threshold. In this regime, the model had only a single stable steady state. (E) Morphology of HL-60 as a function of ATRA concentration (t = 72 hr). Experimental data in panels A and B were reproduced from Wang and Yen, data in panel E is reported in this study.
Figure 3
Figure 3
Model simulation following exposure to 1 μ M ATRA. (A) BLR1 mRNA versus time with and without MAPK inhibitor. (B) cRaf-pS621 versus time following pulsed exposure to 1 μM ATRA with and without BLR1. Solid lines denote the mean model performance, while shaded regions denote the 99% confidence interval calculated over the parameter ensemble. (C) Western blot analysis of phosphorylated ERK1/2 in ATRA washout experiments. Experimental data in panels A and B were reproduced from Wang and Yen, data in panel C is reported in this study. The image of the raw gel for panel C is given in the Supplemental Materials.
Figure 4
Figure 4
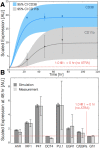
Model simulation of the HL-60 gene expression program following exposure to 1 μM ATRA at t = 0 hr. (A) Scaled CD38 and CD11b expression versus time following ATRA exposure at time t = 0 hr. (B) Scaled Gene expression at t = 48 hr following ATRA exposure. Gene expression was normalized to expression in the absence of ATRA. The gene expression is quantified by the protein fold change of quantified Western blot data (from at least three biological repeat nuclear lysates) using ImageJ. Experimental data in panels A and B were reproduced from Jensen et al.. Model simulations were conducted using the ten best parameter sets collected during model identification. Solid lines (or bars) denote the mean model performance, while the shaded region (or error bars) denote the 95% confidence interval calculated over the parameter ensemble.
Figure 5
Figure 5
Model simulation of HL-60 cell-cycle arrest following exposure to 1 μM ATRA at t = 0 hr. (A) Predicted p21 and E2F expression levels for the best parameter set following ATRA exposure at time t = 0 hr. (B) Estimated fraction of HL-60 cells in G0 arrest following ATRA exposure at time t = 0 hr. Solid lines (or bars) denote the mean model performance, while the shaded region (or error bars) denotes the 95% confidence estimate of the polynomial model. Experimental data in panel B was reproduced from Jensen et al..
Figure 6
Figure 6
Robustness of the HL-60 differentiation program following exposure to 1 μM ATRA at t = 0 hr. (A) Singular value decomposition of the average system response (l2-norm between the perturbed and nominal state) following pairwise gene knockout simulations using the top ten best fit parameter sets. The rows denote the deleted genes, while columns denote the response mode. (B) Singular value decomposition of the average system response (l2-norm between the perturbed and nominal state) following the pairwise removal of protein-DNA connections for the top ten best fit parameter sets. The rows denote protein-DNA interactions at the labeled promoter, while the columns denote the top ranked response modes (combinations of deletions). The percentage at the top of each column describes the fraction of the variance in the system state captured by the node combinations in the rows.
Figure 7
Figure 7
Robustness of the HL-60 differentiation program following exposure to 1 μM ATRA at t = 0 hr. Protein fold change at t = 48 hr (rows) in single and double knock-out mutants (columns) relative to wild-type HL-60 cells. The responses were grouped into >2,4 and 8 fold changes. The best fit parameter set was used to calculate the protein fold change.
Figure 8
Figure 8
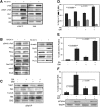
Investigation of a panel of possible Raf interaction partners in the presence and absence of ATRA. (A) Species identified to precipitate out with Raf: first column shows Western blot analysis on total Raf immunoprecipitation with and without 24 hr ATRA treatment and the second on total lysate. (B) The expression of species considered that did not precipitate out with Raf at levels detectable by Western blot analysis on total lysate. (C) Effect of the Raf inhibitor GW5074 on Raf interactions as determined by Western blot analysis of total Raf immunoprecipitation. The Authors note the the signal associated with Src was weak. (D) Cell Cycle distribution as determined by flow cytometry indicated arrest induced by ATRA, which was increased by the addition of GW5074. (E) Expression of the cell surface marker CD11b as determined by flow cytometry indicated increased expression induced by ATRA, which was enhanced by the addition of GW5074. (F) Inducible reactive oxygen species (ROS) as determined by DCF flow cytometry. The functional differentiation response of ATRA treated cells was mitigated by GW5074. GAPDH was used as a loading control. The black lines frame groupings from independent gels and each image is typical of three repeats. Images of the raw gels for panels A, B C and F are given in the Supplemental Materials.
Figure 9
Figure 9
This schematic diagram shows the hypothetical principal pathways in the ATRA–induced signaling that results in cell differentiation in the HL-60 myeloid leukemia model,–. It is based on modules and feedback loops. There are three main arms (shown top to bottom): 1. Direct ATRA targeting of RAREs in genes such as CD38 or BLR1; 2. Formation of a signalsome that has a regulatory module that includes Vav (a guanine nucleotide exchange factor), CBL and SLP-76 (adaptors), and Lyn (a Src family kinase) that regulates a Raf/Mek/Erk axis that incorporates Erk to Raf feedback, where the regulators are modulated by AhR and CD38 receptors; and 3. Direct ATRA targeted up regulation of CDKI to control RB hypophosphorylation. The Raf/Mek/Erk axis is embedded in the signalsome and subject to modulation by the regulators. The output of the signalsome is discharge of the Raf from the cytosol to the nucleus where it binds (hyper)phospho-RB and other targets, including NFATc3, which enables activation of the ATRA bound RAR/RXR poised on the BLR1 promoter, and also GSK3, phosphorylation of which relieves its inhibitory effect on RAR α. CDKI directed hypophosphorylation of RB releases Raf sequestered by RB to go to NFATc3, GSK3, and other targets. A significant consequence of the nuclear RAF is ergo ultimately to enable or hyperactivate transcriptional activation by RAR α to drive differentiation. It might be noted that this proposed general model provides a mechanistic rationalization for why cell cycle arrest is historically oft times perceived as a precondition for phenotypic maturation.

Similar articles

Cited by

References

    1. Bushue N, Wan Y-JY. Retinoid pathway and cancer therapeutics. Adv Drug Deliv Rev. 2010;62:1285–98. doi: 10.1016/j.addr.2010.07.003. - DOI - PMC - PubMed
    1. Tang X-H, Gudas LJ. Retinoids, retinoic acid receptors, and cancer. Annu Rev Pathol. 2011;6:345–64. doi: 10.1146/annurev-pathol-011110-130303. - DOI - PubMed
    1. Cheung FSG, Lovicu FJ, Reichardt JKV. Current progress in using vitamin d and its analogs for cancer prevention and treatment. Expert Rev Anticancer Ther. 2012;12:811–37. doi: 10.1586/era.12.53. - DOI - PubMed
    1. Uray IP, Dmitrovsky E, Brown PH. Retinoids and rexinoids in cancer prevention: from laboratory to clinic. Semin Oncol. 2016;43:49–64. doi: 10.1053/j.seminoncol.2015.09.002. - DOI - PMC - PubMed
    1. Li C, Imai M, Hasegawa S, Yamasaki M, Takahashi N. Growth inhibition of refractory human gallbladder cancer cells by retinol, and its mechanism of action. Biol Pharm Bull. 2017;40:495–503. doi: 10.1248/bpb.b16-00934. - DOI - PubMed

Publication types

LinkOut - more resources