Akt inhibition improves long-term tumour control following radiotherapy by altering the microenvironment
- PMID: 29084756
- PMCID: PMC5709765
- DOI: 10.15252/emmm.201707767
Akt inhibition improves long-term tumour control following radiotherapy by altering the microenvironment
Abstract
Radiotherapy is an important anti-cancer treatment, but tumour recurrence remains a significant clinical problem. In an effort to improve outcomes further, targeted anti-cancer drugs are being tested in combination with radiotherapy. Here, we have studied the effects of Akt inhibition with AZD5363. AZD5363 administered as an adjuvant after radiotherapy to FaDu and PE/CA PJ34 tumours leads to long-term tumour control, which appears to be secondary to effects on the irradiated tumour microenvironment. AZD5363 reduces the downstream effectors VEGF and HIF-1α, but has no effect on tumour vascularity or oxygenation, or on tumour control, when administered prior to radiotherapy. In contrast, AZD5363 given after radiotherapy is associated with marked reductions in tumour vascular density, a decrease in the influx of CD11b+ myeloid cells and a failure of tumour regrowth. In addition, AZD5363 is shown to inhibit the proportion of proliferating tumour vascular endothelial cells in vivo, which may contribute to improved tumour control with adjuvant treatment. These new insights provide promise to improve outcomes with the addition of AZD5363 as an adjuvant therapy following radiotherapy.
Keywords: Akt; microenvironment; radiotherapy.
© 2017 The Authors. Published under the terms of the CC BY 4.0 license.
Figures
- A, B
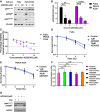
Cells were treated with 1 μM or 10 μM AZD5363 for 2 h before lysis on ice. (A) Western blots were performed with antibodies detecting pAkt, pGSK3β, pS6 and the housekeeping protein vinculin. A blot representative of three independent experiments is shown in the panel (n = 3 experiments). (B) ELISA was used to measure levels of pPRAS40 (n = 3 experiments).
- C
MTT assay of cells treated with 1–10 μM AZD5363 for 96 h (n = 3 experiments).
- D, E
Clonogenic assay of FaDu (D) and PE/CA PJ34 (E) cells treated with 1 μM or 10 μM AZD5363 for 2 h before, and 24 h after a single dose of RT (2, 4 or 6 Gy) (n = 3 experiments).
- F
Surviving fraction of FaDu cells after a single 4 Gy dose of RT combined with varying schedules of 1 μM AZD5363 (n = 3 experiments).
- G
Cells were treated with 1 μM AZD5363 for 2 h before and 24 h after a single 4 Gy dose of RT before lysis on ice. Western blots were performed with antibodies detecting pAkt, pGSK3β and the housekeeping protein GAPDH. A blot representative of three independent experiments is shown in the panel (n = 3 experiments).
- A
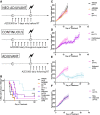
Diagram displaying the differing sequences of AZD5363 used in combination with RT in FaDu tumour‐bearing mice.
- B
Percentage of mice with tumour control on each experimental day. Plots show the combined data of two independent experiments (n = 6‐13 mice/group).
- C–F
Growth of FaDu tumours treated with AZD5363 (50 mg/kg BD) or 6 Gy RT alone (C), or in combination, with the drug given continuously (D), as an adjuvant (E) or as a neo‐adjuvant (F). Plots show the combined data of two independent experiments (n = 6‐13 mice/group).

- A
Percentage of mice with tumour control on each experimental day.
- B–D
Tumour volumes for single‐agent AZD5363 and RT (B), neo‐adjuvant (C) or adjuvant (D) AZD5363 (50 mg/kg BD).
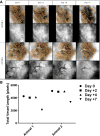
Mice were imaged using bright‐field microscopy on days 2, 4 and 7 following RT.
Total vessel length estimated with the assistance of computer software.

Sections demonstrating CD31 staining to allow visualisation of tumour vessels; 10× magnification.
Vessel density as measured in tumour sections.
Sections demonstrating pimonidazole staining to allow assessment of hypoxia; 10× magnification.
Percentage of pimonidazole‐positive viable tumour cells.
- A
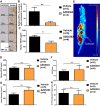
Representative tumour sections stained with anti‐HIF‐1α antibody (10× magnification).
- B
HIF‐1α levels relative to vehicle control mice.
- C, D
ELISA measurement of human and mouse VEGF, respectively.
- E
Example FAZA PET/CT of a FaDu tumour‐bearing mouse.
- F
18F‐FAZA accumulation in tumours as measured by standardised uptake values (SUV) mean.
- G
Tumour vessel density (CD31 staining).
- H
Tumour hypoxia levels (pimonidazole staining).
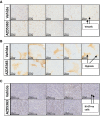
CD31 staining to allow visualisation of tumour vessels, 10× magnification.
Pimonidazole staining to allow estimation of tumour hypoxia, 10× magnification.
Ki‐67 staining to assess tumour cell proliferation, 10× magnification.
- A–E
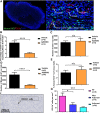
Tumours from FaDu xenograft‐bearing mice treated with AZD5363 (50 mg/kg BD) or vehicle for 7 days were harvested for histological analysis and stained for co‐expression of CD31 and mouse Ki‐67 (A–D), or human Ki‐67 (E); 3 consecutive sections stained and analysed; n = 4‐5/group. (A) Example of a whole (left) and magnified (right) section stained for CD31, mouse Ki‐67 and DAPI (20× magnification). (B) Percentage of CD31+ cells co‐expressing mouse Ki‐67. (C) Number of CD31+ cells. (D) Number of mouse Ki‐67+ cells. (E) Percentage of human Ki‐67+ viable tumour cells.
- F
Typical section of an RT control tumour stained with anti‐CD11b antibody; 100× magnification.
- G
Number of CD11b+ bone marrow‐derived cells, per unit area of viable tumour; 3 consecutive sections stained and analysed; n = 4–5/group.
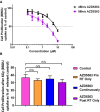
HUVEC cells (1,000 cells/well) were seeded in a gelatin‐coated 96‐well plate and treated with doses of AZD5363 ranging from 0.1 to 10 μM for either 48 or 96 h. BrdU was added overnight, and an ELISA then performed to detect BrdU incorporation. A greater than 50% reduction in proliferation is produced with AZD5363 at a dose of between 2 and 3 μM (n = 3 experiments).
A BrdU assay was performed as in (A) but with the addition of 1 μM AZD5363 for 2 h before, 2 h before and 96 h after, or for 96 h after, a single 6‐Gy dose of RT. None of the treatment schedules produced a greater than additive effect on the proliferation of vascular endothelial cells 96 h after a single 6‐Gy dose of RT.
Similar articles
-
2-Deoxy-2-[18F]fluoro-D-glucose positron emission tomography demonstrates target inhibition with the potential to predict anti-tumour activity following treatment with the AKT inhibitor AZD5363.Mol Imaging Biol. 2013 Aug;15(4):476-85. doi: 10.1007/s11307-013-0613-3. Mol Imaging Biol. 2013. PMID: 23344784
-
The AKT inhibitor AZD5363 is selectively active in PI3KCA mutant gastric cancer, and sensitizes a patient-derived gastric cancer xenograft model with PTEN loss to Taxotere.J Transl Med. 2013 Oct 2;11:241. doi: 10.1186/1479-5876-11-241. J Transl Med. 2013. PMID: 24088382 Free PMC article.
-
AKT Antagonist AZD5363 Influences Estrogen Receptor Function in Endocrine-Resistant Breast Cancer and Synergizes with Fulvestrant (ICI182780) In Vivo.Mol Cancer Ther. 2015 Sep;14(9):2035-48. doi: 10.1158/1535-7163.MCT-15-0143. Epub 2015 Jun 26. Mol Cancer Ther. 2015. PMID: 26116361
-
Targeting Akt in Hepatocellular Carcinoma and Its Tumor Microenvironment.Int J Mol Sci. 2021 Feb 11;22(4):1794. doi: 10.3390/ijms22041794. Int J Mol Sci. 2021. PMID: 33670268 Free PMC article. Review.
-
Akt Inhibitor Advancements: From Capivasertib Approval to Covalent-Allosteric Promises.J Med Chem. 2024 Apr 25;67(8):6052-6063. doi: 10.1021/acs.jmedchem.4c00075. Epub 2024 Apr 9. J Med Chem. 2024. PMID: 38592948 Review.
Cited by
-
lncTUG1/miR-144-3p affect the radiosensitivity of esophageal squamous cell carcinoma by competitively regulating c-MET.J Exp Clin Cancer Res. 2020 Jan 9;39(1):7. doi: 10.1186/s13046-019-1519-y. J Exp Clin Cancer Res. 2020. PMID: 31918742 Free PMC article.
-
AKIP1 promotes glioblastoma viability, mobility and chemoradiation resistance via regulating CXCL1 and CXCL8 mediated NF-κB and AKT pathways.Am J Cancer Res. 2021 Apr 15;11(4):1185-1205. eCollection 2021. Am J Cancer Res. 2021. PMID: 33948353 Free PMC article.
-
Systemic Bioequivalence Is Unlikely to Equal Target Site Bioequivalence for Nanotechnology Oncologic Products.AAPS J. 2019 Feb 1;21(2):24. doi: 10.1208/s12248-019-0296-z. AAPS J. 2019. PMID: 30710324 Free PMC article. Review.
-
Akt regulates RSK2 to alter phosphorylation level of H2A.X in breast cancer.Oncol Lett. 2021 Mar;21(3):187. doi: 10.3892/ol.2021.12448. Epub 2021 Jan 6. Oncol Lett. 2021. PMID: 33574926 Free PMC article.
-
Sirt3 deficiency impairs neurovascular recovery in ischemic stroke.CNS Neurosci Ther. 2018 Sep;24(9):775-783. doi: 10.1111/cns.12853. Epub 2018 May 18. CNS Neurosci Ther. 2018. PMID: 29777578 Free PMC article.
References
-
- Banerji U, Ranson M, Schellens JH, Esaki T, Dean E, Zivi A, Van der Noll R, Stockman PK, Marotti M, Garrett MD (2013) Abstract LB‐66: results of two phase I multicenter trials of AZD5363, an inhibitor of AKT1, 2 and 3: biomarker and early clinical evaluation in Western and Japanese patients with advanced solid tumors. Can Res 73: LB‐66
-
- Bernier J, Hall EJ, Giaccia A (2004) Radiation oncology: a century of achievements. Nat Rev Cancer 4: 737–747 - PubMed
-
- Bussink J, van der Kogel AJ, Kaanders JHAM (2008) Activation of the PI3‐K/AKT pathway and implications for radioresistance mechanisms in head and neck cancer. Lancet Oncol 9: 288–296 - PubMed
-
- Cantley LC (2002) The phosphoinositide 3‐kinase pathway. Science 296: 1655–1657 - PubMed
MeSH terms
Substances
Grants and funding
LinkOut - more resources
Full Text Sources
Other Literature Sources
Medical
Research Materials

