. 2017 Oct 27;8(1):1164.
doi: 10.1038/s41467-017-01283-z.

A neuroprotective astrocyte state is induced by neuronal signal EphB1 but fails in ALS models

Affiliations

A neuroprotective astrocyte state is induced by neuronal signal EphB1 but fails in ALS models

Giulia E Tyzack et al. Nat Commun. .

Abstract

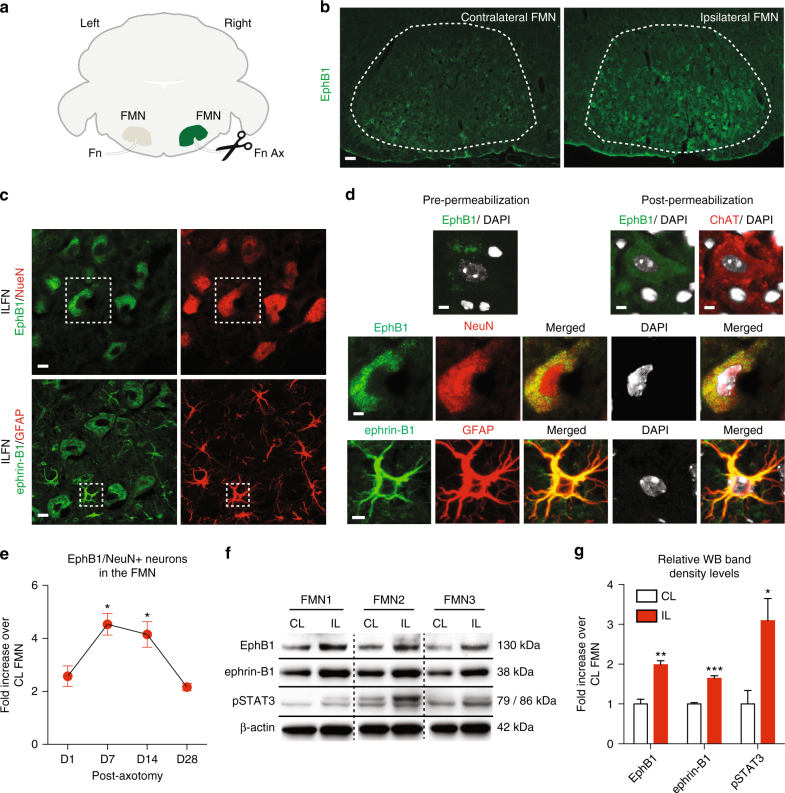
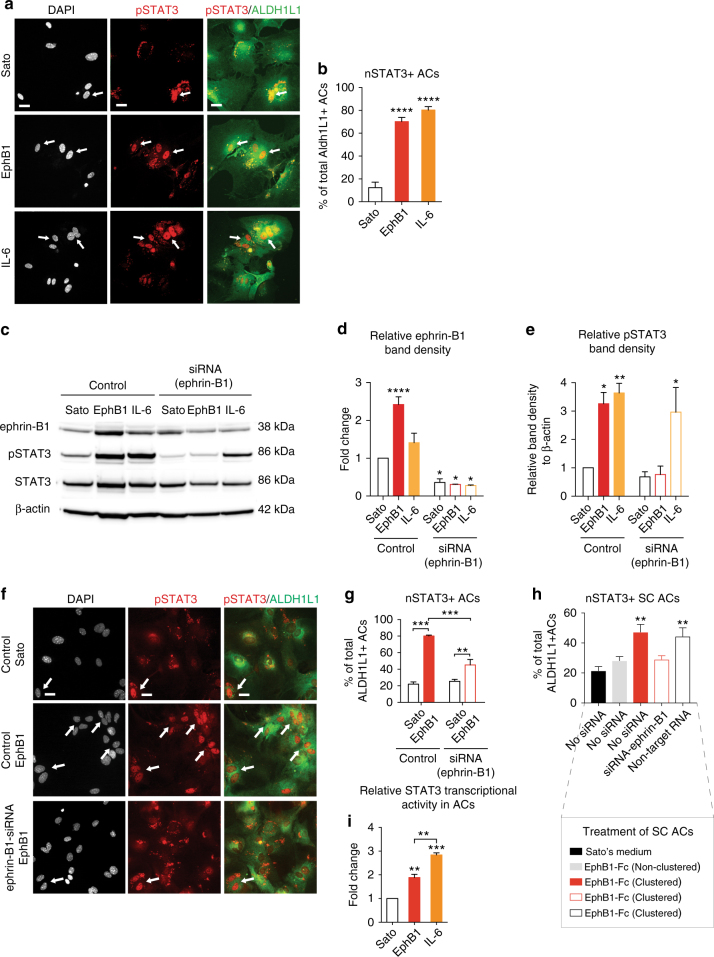
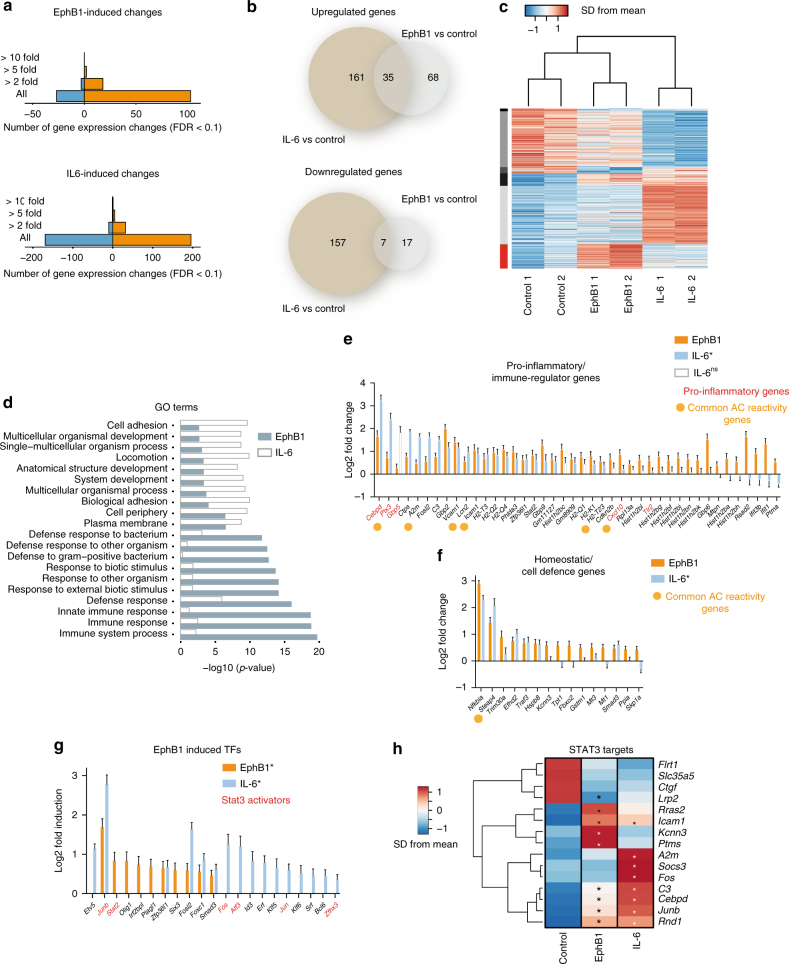
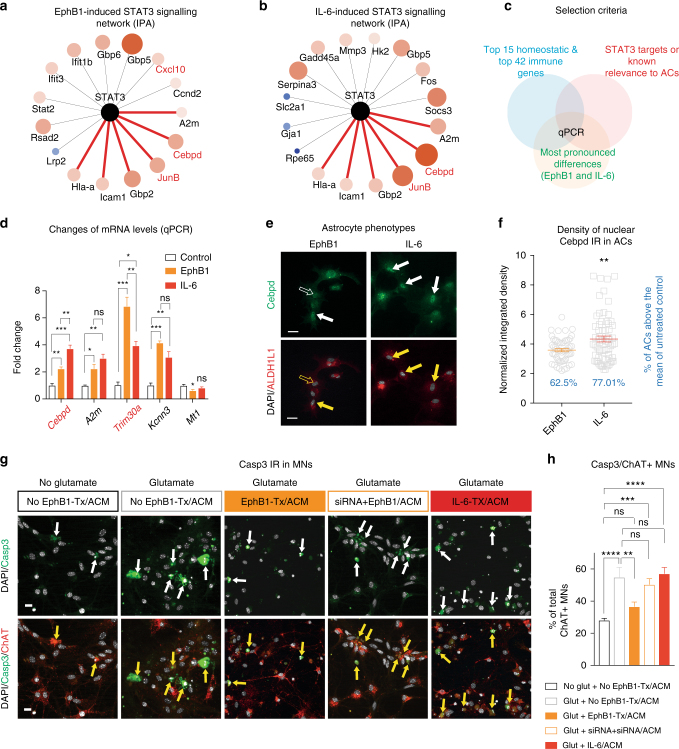
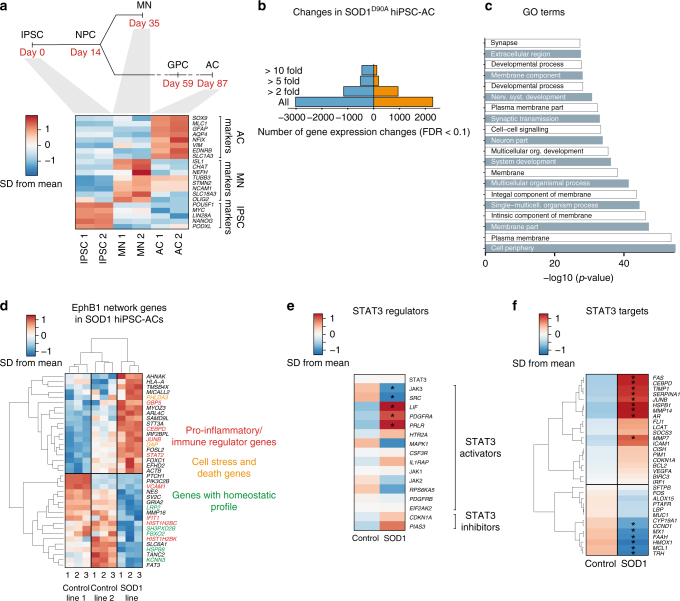
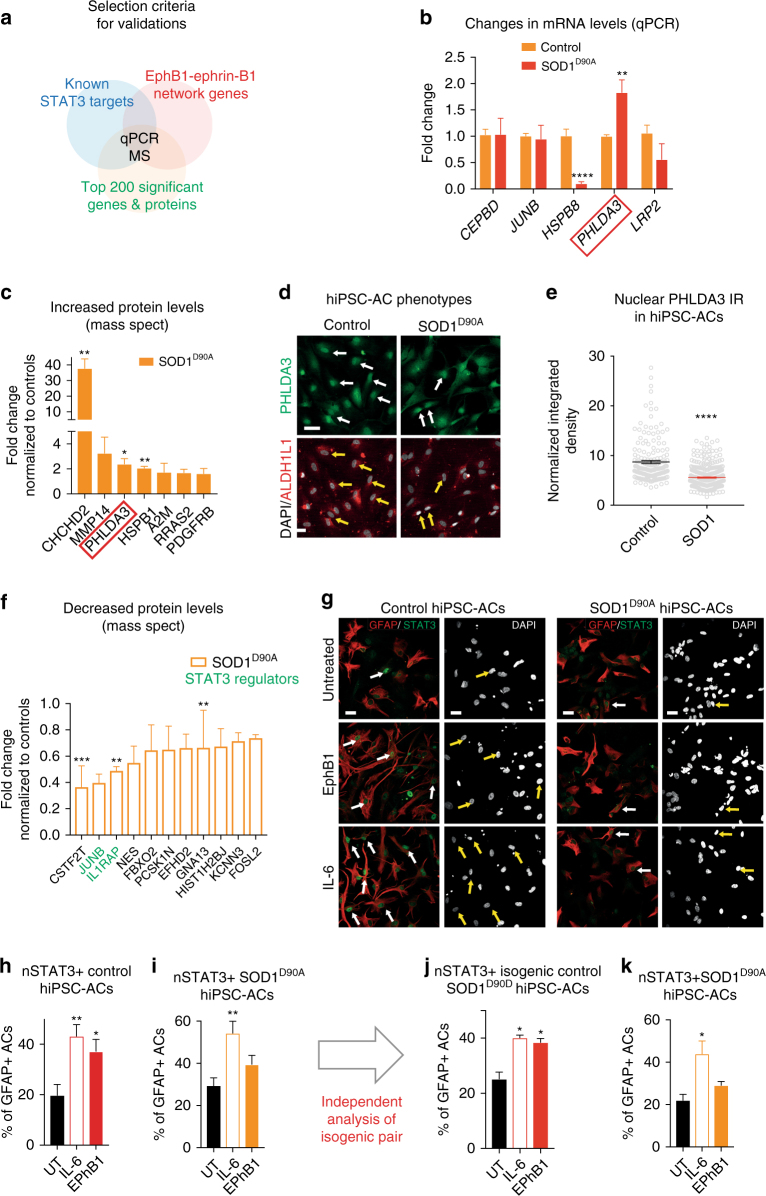
Astrocyte responses to neuronal injury may be beneficial or detrimental to neuronal recovery, but the mechanisms that determine these different responses are poorly understood. Here we show that ephrin type-B receptor 1 (EphB1) is upregulated in injured motor neurons, which in turn can activate astrocytes through ephrin-B1-mediated stimulation of signal transducer and activator of transcription-3 (STAT3). Transcriptional analysis shows that EphB1 induces a protective and anti-inflammatory signature in astrocytes, partially linked to the STAT3 network. This is distinct from the response evoked by interleukin (IL)-6 that is known to induce both pro inflammatory and anti-inflammatory processes. Finally, we demonstrate that the EphB1-ephrin-B1 pathway is disrupted in human stem cell derived astrocyte and mouse models of amyotrophic lateral sclerosis (ALS). Our work identifies an early neuronal help-me signal that activates a neuroprotective astrocytic response, which fails in ALS, and therefore represents an attractive therapeutic target.


Conflict of interest statement

The authors declare no competing financial interests.

Figures

Fig. 1
Fig. 1
EphB1 is upregulated in axotomised neurons, where astrocytes display ephrin-B1 IR. a Schematic diagram demonstrating right-sided unilateral facial nerve (Fn) axotomy (Ax) and the associated ipsilateral (IL) facial motor nucleus (FMN) in which immunofluorescence was analysed in comparison with the non-axotomised contralateral (CL) FMN. b Representative immunofluorescence images showing abundant EphB1 IR 14 days after axotomy in the IL FMN in which 98% of neurons are defined as motor neurons. c Images showing EphB1 and NeuN labelling and also ephrin-B1 and GFAP IR in corresponding neurons or astrocytes (ACs), respectively. d High magnification images demonstrate cell surface labelling for EphB1 in sections immunostained before permeabilisation and also cytoplasmic EphB1 IR post-permeabilisation in a ChAT-positive motor neuron (MN) (see also Supplementary Fig. 1) and NeuN positive neurons with motor neuron morphology in the middle panel. In the lower panel ephrin-B1 positivity is demonstrated in GFAP-labelled astrocyte soma and processes (see also Supplementary Fig. 1). e Graph showing the mean of fold changes in the proportion of EphB1-positive neurons in the IL FMN normalised to the CL FMN following axotomy (1, 7, 14, 28 days; n = 3 per time point, respectively, and 3–4 brainstem sections in each group; *p = 0.016, *p = 0.046 compared to values at day 1, F = 9.431; one-way ANOVA with Dunnett’s post hoc test; see also Supplementary Fig. 1). f Western blot (WB) showing EphB1, ephrin-B1 and pSTAT3 protein levels (both 79 and 86 kDa isoforms) in tissue lysates from both the IL and CL FMN of three WT mice at day 14 post-axotomy (see also Supplementary Fig. 8). g Bar graph represent relative WB band densities of EphB1, ephrin-B1 and pSTAT3 in the IL FMN and is expressed as fold increase over the band density levels for the CL FMN after normalisation to β-actin (n = 3 mice, unpaired t-test, **p = 0.006, ***p = 0.0004, *p = 0.034). Data presented as mean ± SEM. Scale bars: 50 μm for (b), 20 μm for (c) and 10 μm for (d)
Fig. 2
Fig. 2
EphB1 acts via ephrin-B1 to induce astrocytic STAT3 activation, and increases transcriptional activity. a Immunofluorescence showing nuclear localisation of pSTAT3 (nSTAT3) in ALDH1L1-positive astrocytes (ACs) untreated in Sato’s medium or stimulated with EphB1 or IL-6. b Graph shows the percentage of astrocytes displaying nSTAT3 (n = 6 cultures from 6 mice; **** p ≤ 0.0001, F = 370). c WBs of ephrin-B1, total STAT3, pSTAT3 and β-actin, comparing protein levels following no treatment (Sato) and EphB1 or IL-6 treatments of non-transfected control astrocytes with ephrin-B1 siRNA silencing (see also Supplementary Fig. 9). d, e Graphs show relative band densities of ephrin-B1 (d) and pSTAT3 (e) to values of non-transfected control astrocytes in Sato’s medium. Data expressed as fold change after normalised to β-actin band density. N = 3 cultures from six mice; *p ≤ 0.05; **p ≤ 0.01; ***p = 0.0001, *p = 0.025, *p = 0.015, *p = 0.012, for ephrin-B1, F = 38.2 and *p = 0.013, **p = 0.0044, *p = 0.031 for pSTAT3, F = 9.914; Dunnett’s test. f Images showing the extent of nSTAT3 IR in ALDH1L1-positive cortical astrocytes in Sato’s medium and after stimulation with EphB1 with/without ephrin-B1 silencing. g Proportion of cortical astrocytes showing nSTAT3 IR 24 h after EphB1 treatment with/without ephrin-B1 silencing (n = 4, 5, 5, 4 cultures from 6 mice, respectively; ***p ≤ 0.001. **p ≤ 0.01, F = 63.44). h Graph represents the proportion of nSTAT3 labelling in spinal cord (SC) astrocytes following non-clustered or clustered EphB1 treatment alone, with ephrin-B1 siRNA or with non-targeting RNA (n = 4, 3, 3, 3 cultures from 6 mice; **p = 0.002, **p = 0.004, respectively, F = 8.78; Dunnett’s comparisons to untreated astrocytes in Sato’s medium). i Dual Luciferase assay showing STAT3-driven transcriptional activity in astrocytes following stimulation with EphB1 or IL-6. Graph shows the fold increase of relative luciferase-reporter activity measured by bioluminescence in EphB1-induced or IL-6-induced astrocytes over untreated samples (n = 3 cultures from 6 mice; **p ≤ 0.01, ***p ≤ 0.001, F = 124). One-way ANOVA with Bonferroni correction was used if not stated otherwise. Data is expressed as mean ± SEM. Scale bar: 15 μm for (a), 20 μm for (f)
Fig. 3
Fig. 3
Transcriptome-wide analyses of purified mouse astrocytes treated with EphB1 or IL-6. a Graphs show the total of changed transcripts induced by EphB1 or IL-6 treatment. b Diagram demonstrating the number of treatment specific and commonly upregulated and downregulated genes (n = 2 independent cultures from 6 mice; FDR ≤ 0.1). c Unsupervised hierarchical clustering of control astrocytes (ACs), IL-6 and EphB1-treated gene expression profiles demonstrates separation of each experimental group. Heatmaps show the representation of top genes by contribution to Principal Component. Vertical colour bar indicates groupings of genes according to patterns of change in response to EphB1 and IL-6. Gene expression data represent SD from mean of variance stabilised values across rows. Upregulated genes are shown in red, downregulated genes are shown in blue. d GO term analysis of significantly induced genes (FDR ≤ 0.1) when comparing EphB1 to IL-6 treatment using the DAVID interface. e,f Significantly induced transcripts by EphB1 in comparison with IL-6-induced response, representing pro-inflammatory/immune-regulator genes (e) or homeostatic/cell defence (f) astrocyte reactivity profiles. For IL-6 non-significant changes are represented by empty bars. Orange dots label commonly upregulated transcripts of reactive astrocytes defined by published data. g Significant EphB1-induced or IL-6-induced TFs in which STAT3 activators are labelled in red. h Heatmaps of STAT3 targets induced by either EPhB1 or IL-6 treatment of astrocytes. Stars represent significantly induced transcripts (p ≤ 0.01) and data represent SD from mean. For graphs data shows log2-fold changes in gene expression ± SEM
Fig. 4
Fig. 4
EphB1 induces a neuroprotective transcriptional programme in astrocytes which is distinct to IL-6 treatment. a,b Predictive EphB1/IL-6 signalling to the STAT3 transcriptomic network. Connections are based on the provided evidence by Ingenuity Pathway Analysis. Red lines indicate connections of STAT3 to inflammatory transcripts, which are overlapping between EphB1-induced and IL-6-induced networks. Both larger node size and darker orange colour indicate increased transcript induction while smaller node size and darker blue colour codes decreased gene expression. c Diagram indicates selection criteria for qPCR based validations. d Graph shows mean fold changes of transcripts in astrocytes (ACs) following EphB1 or IL-6 treatments normalised to untreated controls (n = 3 cultures from 6 mice; **p = 0.003, F = 58.44 for Cebpd and **p = 0.009, F = 44.1 for Trim30a between EphB1 and IL-6 treated groups; one-way ANOVA with Bonferroni post hoc test). e Fluorescence images demonstrate Cebpd IR in EphB1-induced or IL-6-induced ALDH1L1-positive astrocytes. f Dot plot graph shows relative integrated density measurements of nuclear Cebpd IR to the mean of control values after normalisation to background densities (n = 55 for EpHB1, n = 67 for IL-6 from three astrocyte cultures of six mice; **p = 0.002, unpaired t-test). Percentages represent the proportion of astrocytes with higher values than the control threshold. g Immunofluorescence images of motor neurons (MNs) displaying cleaved-caspase3 IR in glutamate toxicity assays, in which the effect of AC conditioned media (ACM) was examined. ACM derived from astrocytes receiving various treatments: untreated or treated astrocytes by EphB1 with or without pre-incubation by ephrin-B1 siRNA and also by IL-6. h Graph demonstrates the mean proportion of glutamate (100 μM) toxicity induced cleaved-caspase3 positive spinal cord motor neurons and the influences imposed on this by various ACM (n = 6, 5, 4, 4, 5 motor neuron populations from six mice in two independent experiments; ****p ≤ 0.0001, ns p = 0.668, ***p = 0.0007 in comparison with non-glutamate treated negative controls or **p = 0.019, ns p = 0.832 and ns p = 0.997, F = 16.41 in comparison with glutamate and ACM treated control, one-way ANOVA with Tukey’s post-test). Scale bar: 20 μm
Fig. 5
Fig. 5
EphB1 and STAT3 expression patterns in the ventral horn of wild type and SOD1G93A-ALS mice. a Schematic diagram and immunofluorescence images showing very low levels of EphB1 immunolabelling in ChAT-positive motor neurons (MNs) in the ventral horn (VH) of unlesioned wild type (WT) and SOD1-mutant mice. White boxes represent the corresponding cells magnified in the insets for each group. b Immunofluoresence demonstrating ALDH1L1-positive astrocytes (ACs) with nuclear STAT3 (nSTAT3) immunostaining (arrows) in unlesioned WT and SOD1-mutant mice. c Graph demonstrates the mean of the EphB1-labelled proportion of ChAT-positive motor neurons in the two groups (n = 4; p = 0.476, unpaired t-test). d Graph demonstrates the mean of the nSTAT3-labelled proportion of ALDH1L1-positive astrocytes in the two groups (n = 4; p = 0.821, unpaired t-test). e Schematic diagram and immunofluorescence images demonstrating EphB1 positivity (arrows) corresponding with ChAT-labelled motor neurons in the ipsilateral (IL) and contralateral (CL) VH of mice following right-sided sciatic nerve (SN) transection. f Graph shows the mean values of fold changes in the proportion of EphB1-labelled motor neurons in the IL VHs when normalised to the CL side (n = 4, p = 0.956 for day 1; n = 3, *p = 0.011 for day 7, unpaired t-test). g Schematic diagram and immunostained tissue sections demonstrating ALDH1L1-positive astrocytes with nSTAT3 IR (arrows). h Graph shows mean values of fold changes in the proportion of nSTAT3-positive astrocytes in the IL VHs normalised to the CL side (n = 3 controls, n = 4 SOD1, p = 0.227 for day 1; n = 4, *p = 0.010 for day 7, unpaired t-test). Data is expressed as mean ± SEM. Scale bar: 40 μm (20 μm for insets)
Fig. 6
Fig. 6
Transcriptome-wide analysis in enriched human SOD1D90A ALS patient-derived iPSC-astrocytes. a Heatmaps indicating exclusive enrichment of astrocyte (AC)-specific genes vs. hiPSC-specific and motor neuron-specific transcripts. b The number of gene expression changes (FDR ≤ 0.1) vs. controls (n = 3 independently converted astrocyte cultures from hiPSCs; see Supplementary Table 1 for information on patient lines). c GO term analysis of genes significantly upregulated when compared to controls using the DAVID interface. d Most significantly downregulated or induced transcripts in control or SOD1 hiPSC-astrocytes, which are overlapping with EphB1-induced mouse astrocyte genes. Known common pro-inflammatory/immune-regulator, cell stress/death genes and transcripts with homeostatic profile are labelled in red, orange and green, respectively. e,f Heatmaps demonstrating upregulation or downregulation of STAT3 inducers and inhibitors (e) and the STAT3 target profile (f) in control and SOD1-mutant hiPSC-astrocytes. Stars in e,f indicate significantly changed genes (FDR ≤ 0.1). For heatmaps gene expression data represent SD from mean of variance stabilised values across rows
Fig. 7
Fig. 7
Validation of dysregulated transcripts within the EphB1–STAT3 network and the failure of STAT3 activation in human SOD1D90A iPSC-astrocytes. a Diagram of selection criteria for validation of gene expression data. b Graph indicates mean fold changes of mRNA of top transcripts when normalised to controls (n = 8 control and 7 SOD1-mutant independently converted hiPSC-astrocyte (AC) cultures, Supplementary Table 1; ****p ≤ 0.0001, **p = 0.003; unpaired t-test). c Graphs show mean fold changes of increased protein levels normalised to the mean of controls when measured by mass spectrometry (MS) (n = 3 independent cultures of SOD1-mutant hiPSC-astrocytes vs. control astrocytes; **p = 0.003, *p = 0.039, **p = 0.0015, unpaired t-test). d PHLDA3 IR pattern in ALDH1L1/DAPI-labelled control and SOD1-mutant hiPSC-astrocytes. e Dot plot graph shows integrated density measurements of nuclear PHLDA3 IR in astrocytes after normalised to background. N = 378 cells from three SOD1 patient-derived hiPSC-astrocytes and 181 cells from two control patients; ****p ≤ 0.0001, unpaired t-test. f Graphs shows mean fold changes of decreased protein levels normalised to the mean of controls when measured by MS (n = 3 independent cultures of SOD1-mutant hiPSC-astrocytes vs. control astrocytes, ***p = 0.0001, **p = 0.009, **p = 0.003, unpaired t-test). g Panels demonstrate immunofluorescence images of GFAP-positive astrocytes with nSTAT3 IR in control and in SOD1 hiPSC-astrocytes. Adjacent panels with DAPI staining illustrate nSTAT3 co-localisation (arrows). hk Graphs represent the proportion of nSTAT3-positive cells among the total of GFAP-positive astrocytes in control (h) or SOD1-mutant hiPSC-cultures (i), which is also independently analysed for the isogenic corrected control/SOD1-mutant pair of hiPSC-astrocyte cultures (j, k). For h and i, n = 13 and 9 independently converted hiPSC-astrocyte cultures; **p = 0.002, *p = 0.029 for controls, **p = 0.003 for SOD1 hiPSC-astrocytes, one-way ANOVA with Bonferroni test. For j and k, n = 2 independently converted astrocyte cultures for the isogenic control and n = 3 for the SOD1-mutant pair; *p = 0.027 for IL-6 and *p = 0.038 for EphB1 in controls; *p = 0.025 for IL-6 and p = 0.777 for EphB1 in SOD1 astrocytes; F = 21.95 and F = 7.8, respectively; one-way ANOVA with Bonferroni test. Data expressed as ± SEM. Scale bar: 30 μm

Similar articles

Cited by

References

    1. Tyzack GE, et al. Astrocyte response to motor neuron injury promotes structural synaptic plasticity via STAT3-regulated TSP-1 expression. Nat. Commun. 2014;5:4294. doi: 10.1038/ncomms5294. - DOI - PMC - PubMed
    1. Faulkner JR, et al. Reactive astrocytes protect tissue and preserve function after spinal cord injury. J. Neurosci. 2004;24:2143–2155. doi: 10.1523/JNEUROSCI.3547-03.2004. - DOI - PMC - PubMed
    1. Anderson MA, et al. Astrocyte scar formation aids central nervous system axon regeneration. Nature. 2016;532:195–200. doi: 10.1038/nature17623. - DOI - PMC - PubMed
    1. Burda JE, Sofroniew MV. Reactive gliosis and the multicellular response to CNS damage and disease. Neuron. 2014;81:229–248. doi: 10.1016/j.neuron.2013.12.034. - DOI - PMC - PubMed
    1. Yamanaka K, et al. Astrocytes as determinants of disease progression in inherited amyotrophic lateral sclerosis. Nat. Neurosci. 2008;11:251–253. doi: 10.1038/nn2047. - DOI - PMC - PubMed

Publication types

MeSH terms